Configuring a Datasource
Litmus 2.0 provides in-house monitoring support which can be leveraged by connecting a data source to the chaos center, configured to scrape chaos event metics and application or infrastructure metics.
Before you begin
To configure a data source for a chaos center project, you must first setup the data source. To learn more about data source setup click here
Connecting a data source
- Click on the
Observabilitysection from the sidebar then switch to theData Sourcetab. Click theAdd data sourcebutton to open the data source connection form.
The first page of the form requires the user to provide the general details, It also has a link to documentation around setting up a Prometheus data source (Litmus center supports Prometheus 2.1 or later) to collect chaos events and metrics along with generic node-exporter and kube-state-metrics. Form fields on page 1 for data source connection:
- Data source name - alias.
- Data source type - defaults to Prometheus in Litmus 2.0.
- Data source endpoint URL - IP OR Host along with port number. The user can also use the Kubernetes DNS provided and kubelet configured fully qualified domain name (FQDN) with port for prometheus server service, prefixed with
http://to connect a data source hosted on the control plane cluster for a secure internal connection on K8s. (Ex. - http://prometheus-k8s.monitoring.svc.cluster.local:9090) - Access type - defaults to Server.
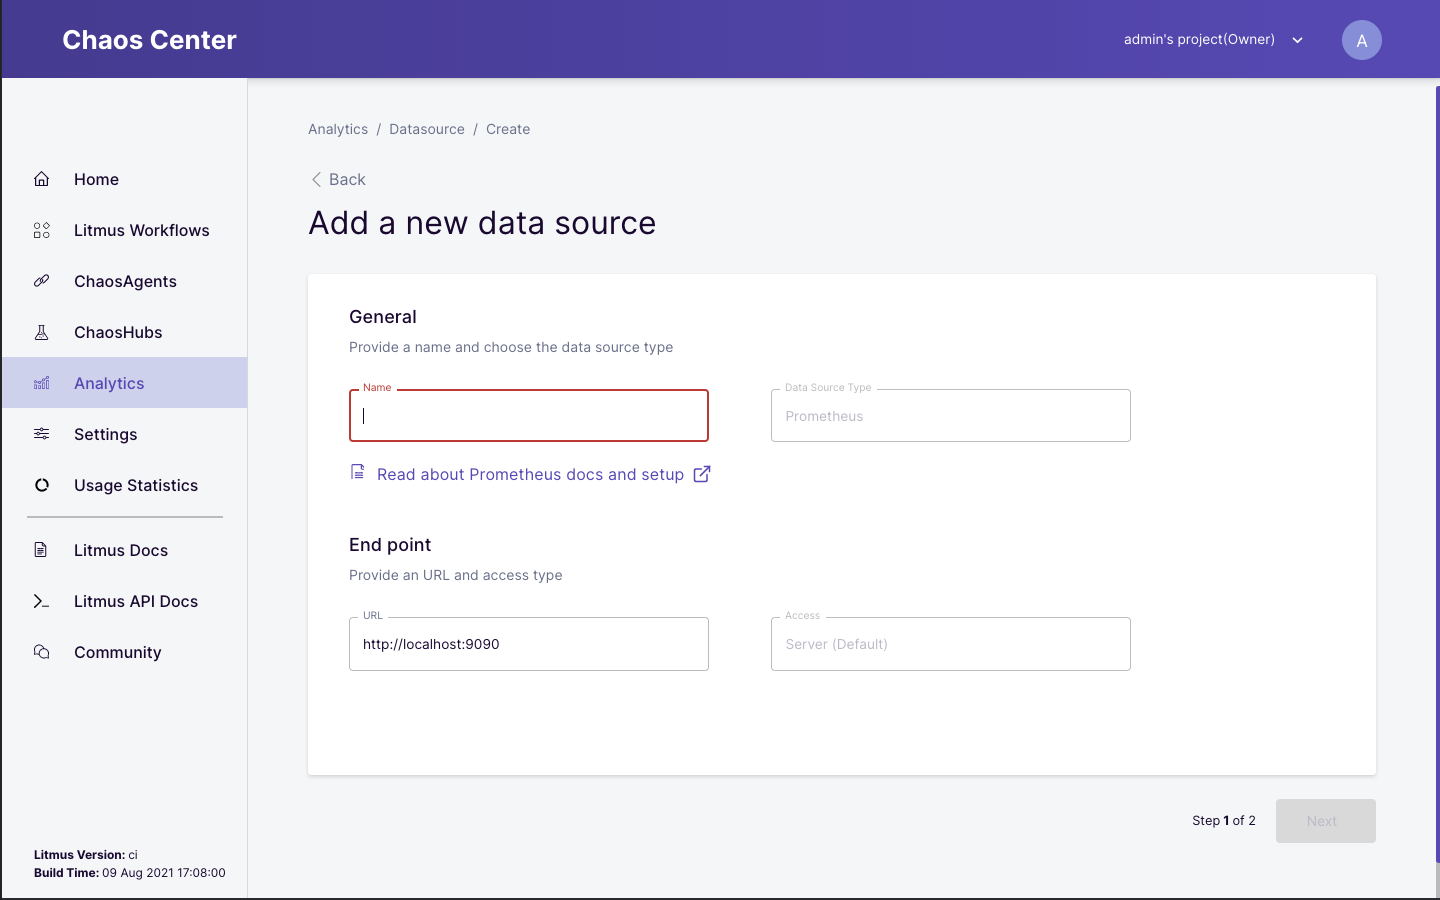 Data source connection form page - 1
On clicking the next button, the second page of the form appears which requires the user to provide more details:
- Authentication option - defaults to
No authfor Litmus 2.0. - Scrape interval - scrape interval in seconds for the TSDB, The scrape interval is used to control the lower limit of minStep for queries multiplying by denominator of query resolution for a dashboard consuming the data source; the same might be used for limiting the refresh rate for dashboard views with relative time range in later versions of the Litmus center.
- Query timeout - query timeout in seconds for the TSDB, The query timeout is used for all the queries associated with all the dashboards connected to the given data source although the default request timeout for the health check of the data source while connecting, updating or listing it is 5 seconds.
- HTTP method - defaults to
POSTas Litmus uses the Prometheus client APIs to query the data source using POST requests which support bigger queries.
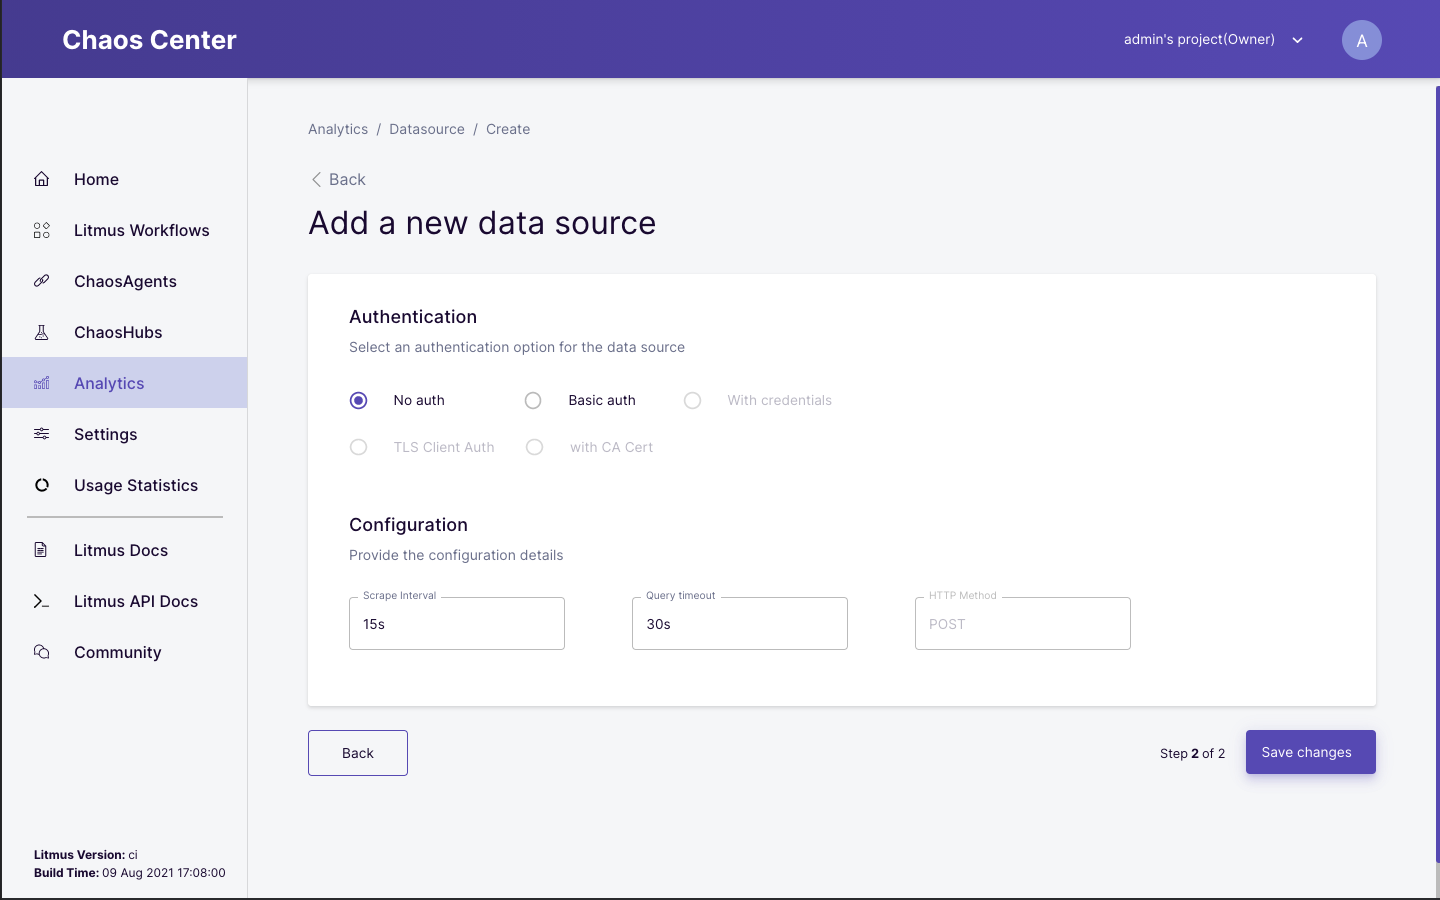 Data source connection form page - 2
After filling up all the details, the user can connect the data source to the project in the Litmus center by clicking the Save changes button.
Data source table, re-configure, deletion
- Click on the
Observabilitysection from the sidebar then switch to theData Sourcetab. This tab contains a data source table which lists all the data sources connected to the Litmus center associated with the currently active project. This table has different fields like,Statuswhich is essentially health check status with a timeout of 5 seconds for each data source,Name,Typewhich defaults to Prometheus for Litmus 2.0,Last configuredandLinkto the data source. The last column has a menu with options toConfigureORDeletethe data source.
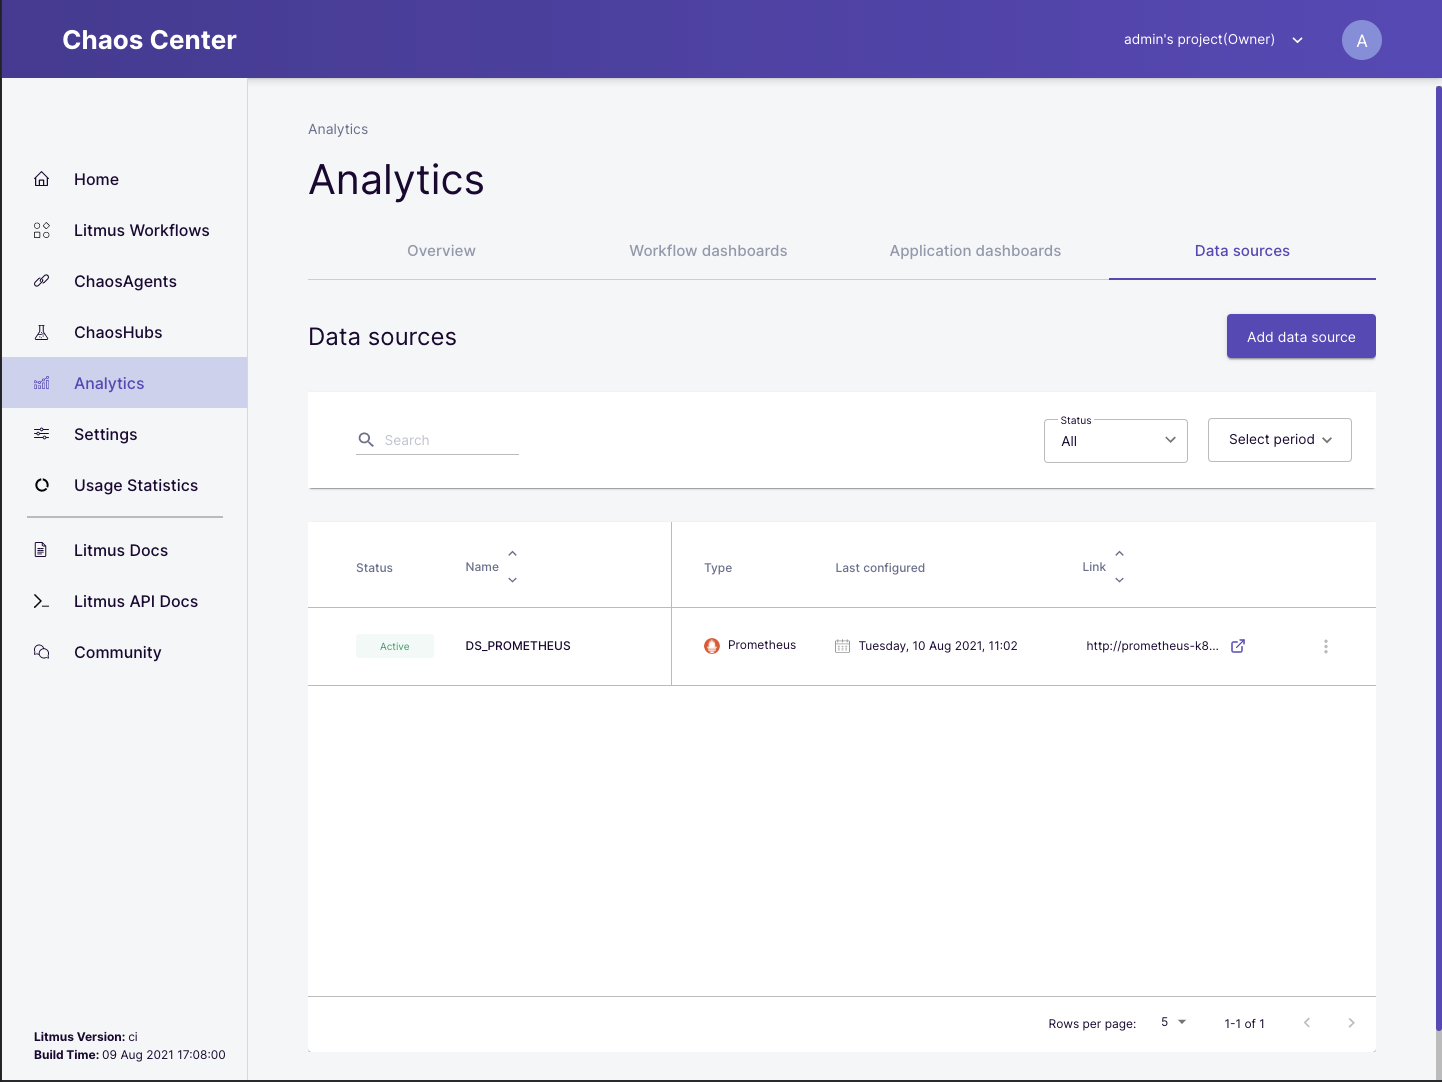 Data sources tab
- Configuring the data source allows the user to update data source details entered while connecting it to the Litmus center. It takes the user to the connection form with the details pre-filled as per previous configuration. The update works only if the data source endpoint is healthy and active.
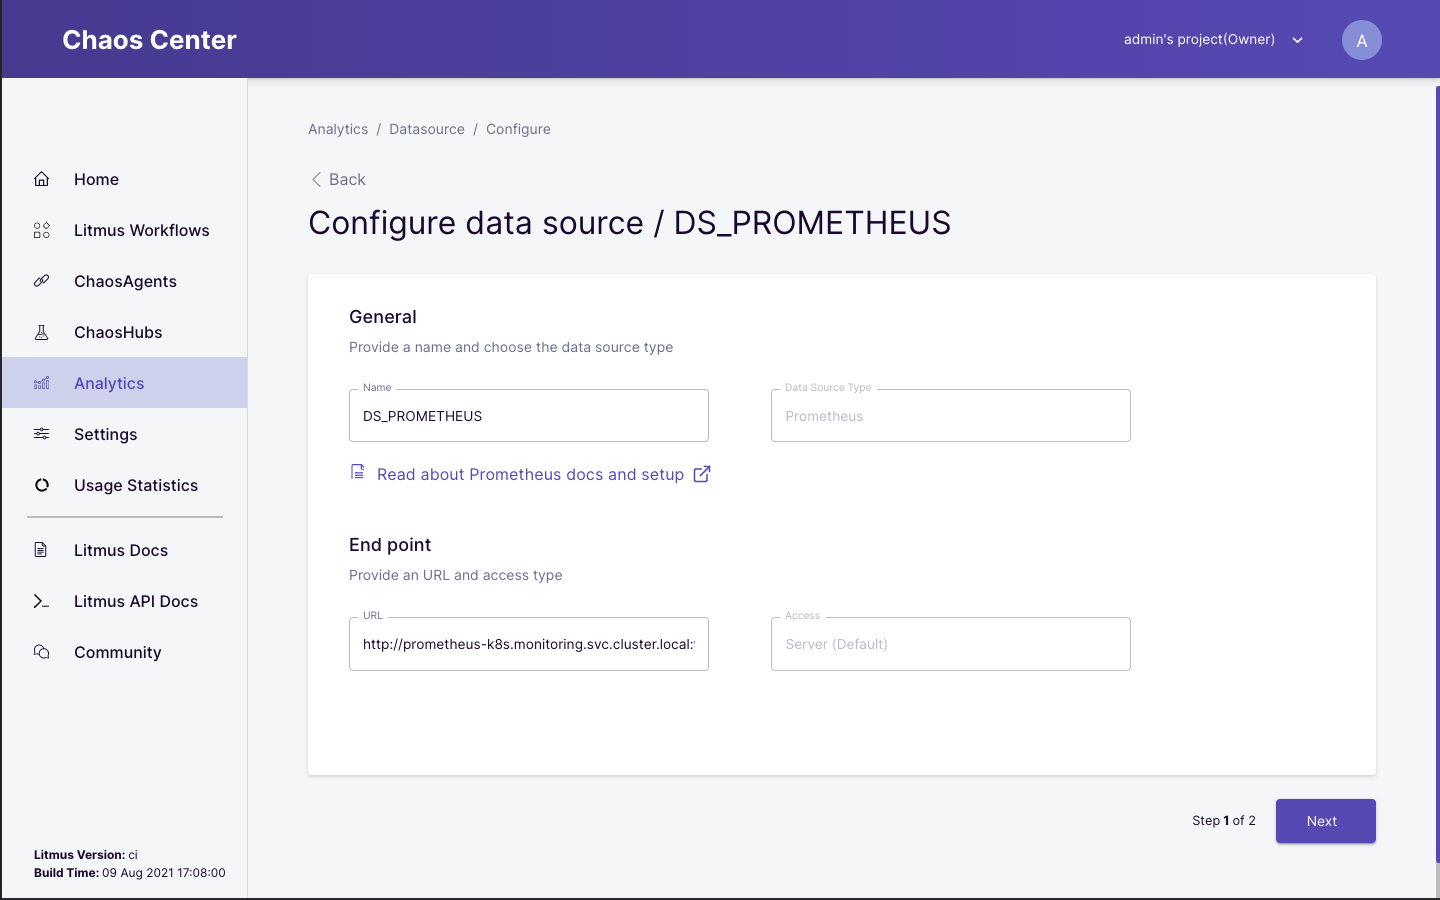 Data source configuration screen
- Deletion allows the user to disconnect the data source from the Litmus center’s project. If any dashboard is consuming the data source then the user is given an option to
Force deletethe data source which also deletes all the dashboards consuming it.
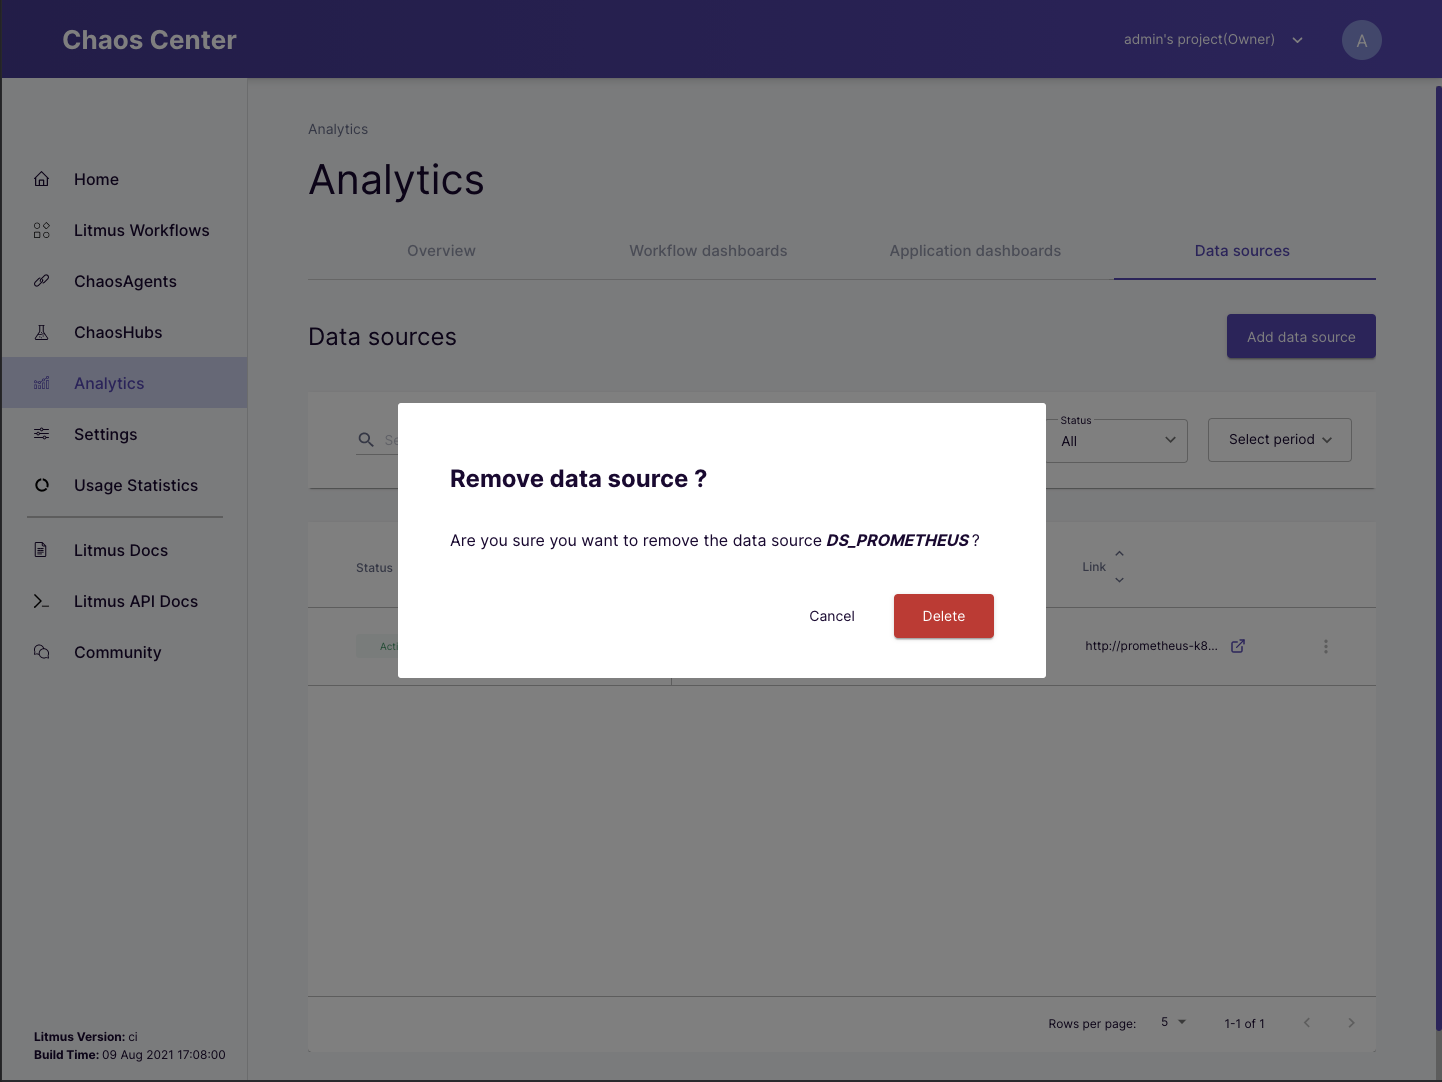 Data source deletion confirmation
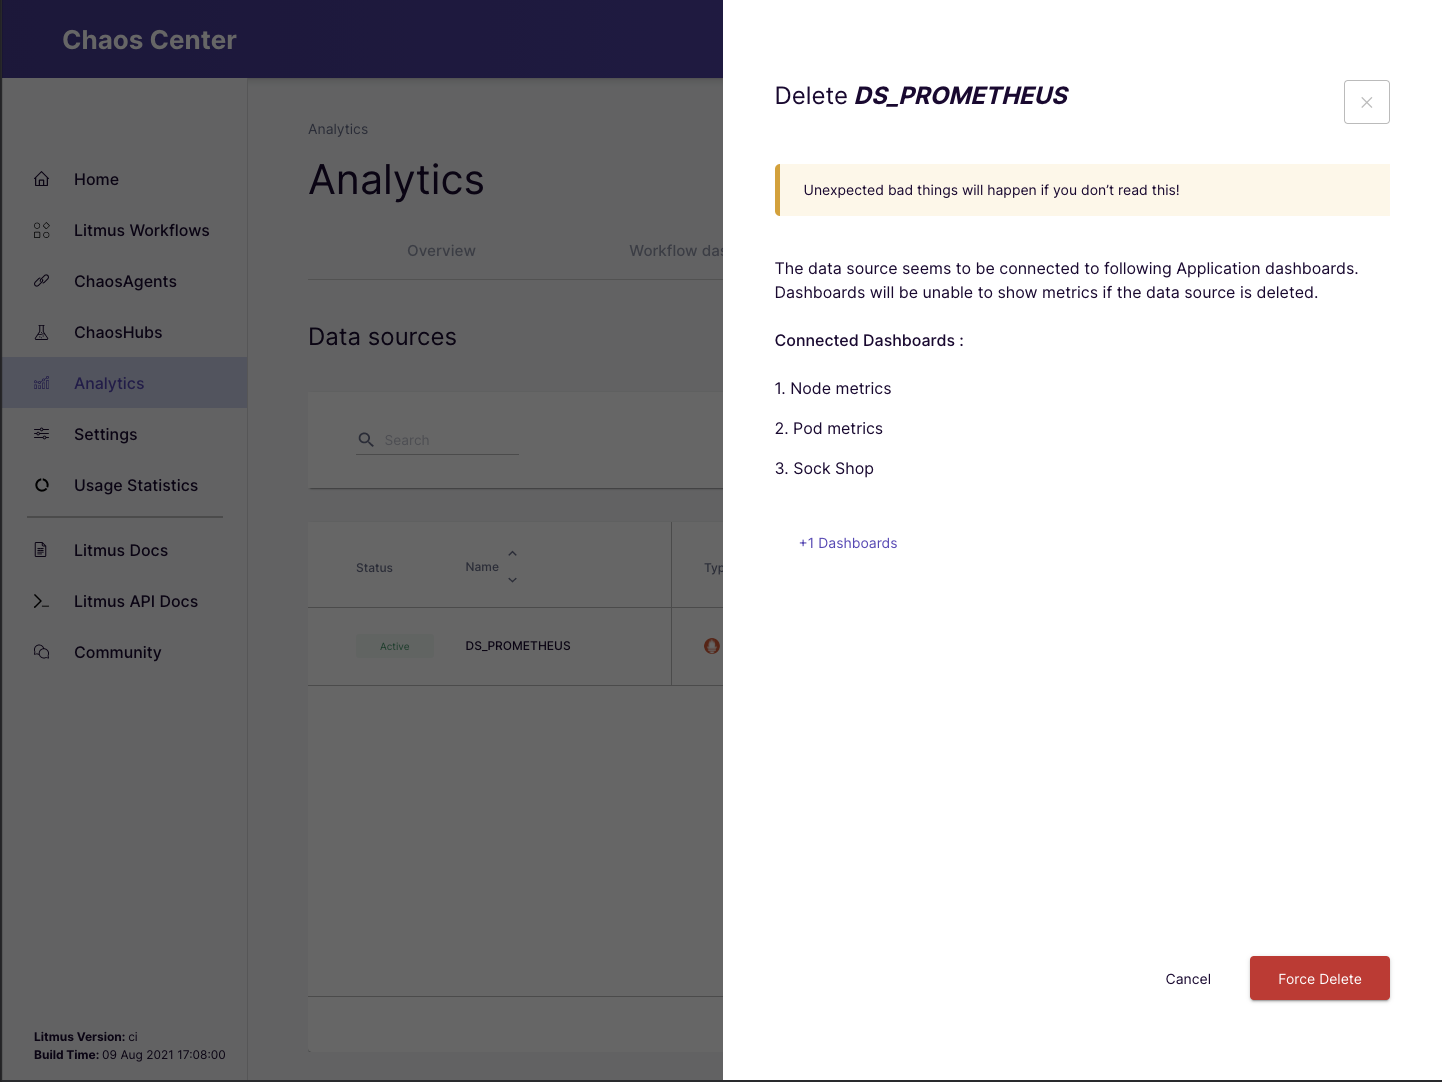 Data source force delete
- The table also allows searching for data source by it’s
Name, filtering entries based onStatusandLast configureddate and time.
Related features
Number of connected data sources are also listed on Overview tab of Observability section and when no data source connected then user is prompted to add a data source while browsing the Application monitoring tab, if an existing inactive data source is found, option to re-configure it is also made available to the user.
Uses of data source in application monitoring
- Data source linking during creation and update of application monitoring dashboards
- Tuning queries for dashboards uses data source details associated with the linked data source
- Application monitoring dashboard uses the data source details to perform a health check before pulling application metrics, chaos events and verdict from it to be observed by the user to analyse chaos impact on services or resources