Creating and Updating an Application Dashboard
Observing chaos injections and deriving insights from the chaos events is the core part of Chaos Observability. Whenever a chaos scenario run is performed its impact may be observed across different services and applications. Application dashboards provide a systematic visualization of all such events along with the performance of the individual service/application. To learn more about the dashboard schema architecture click here
Before you begin
To configure an application dashboard, you must first add a data source. To learn more about data sources click here
- If no data source is available, a banner on the application dashboard tab requests you to add it before configuring a dashboard.
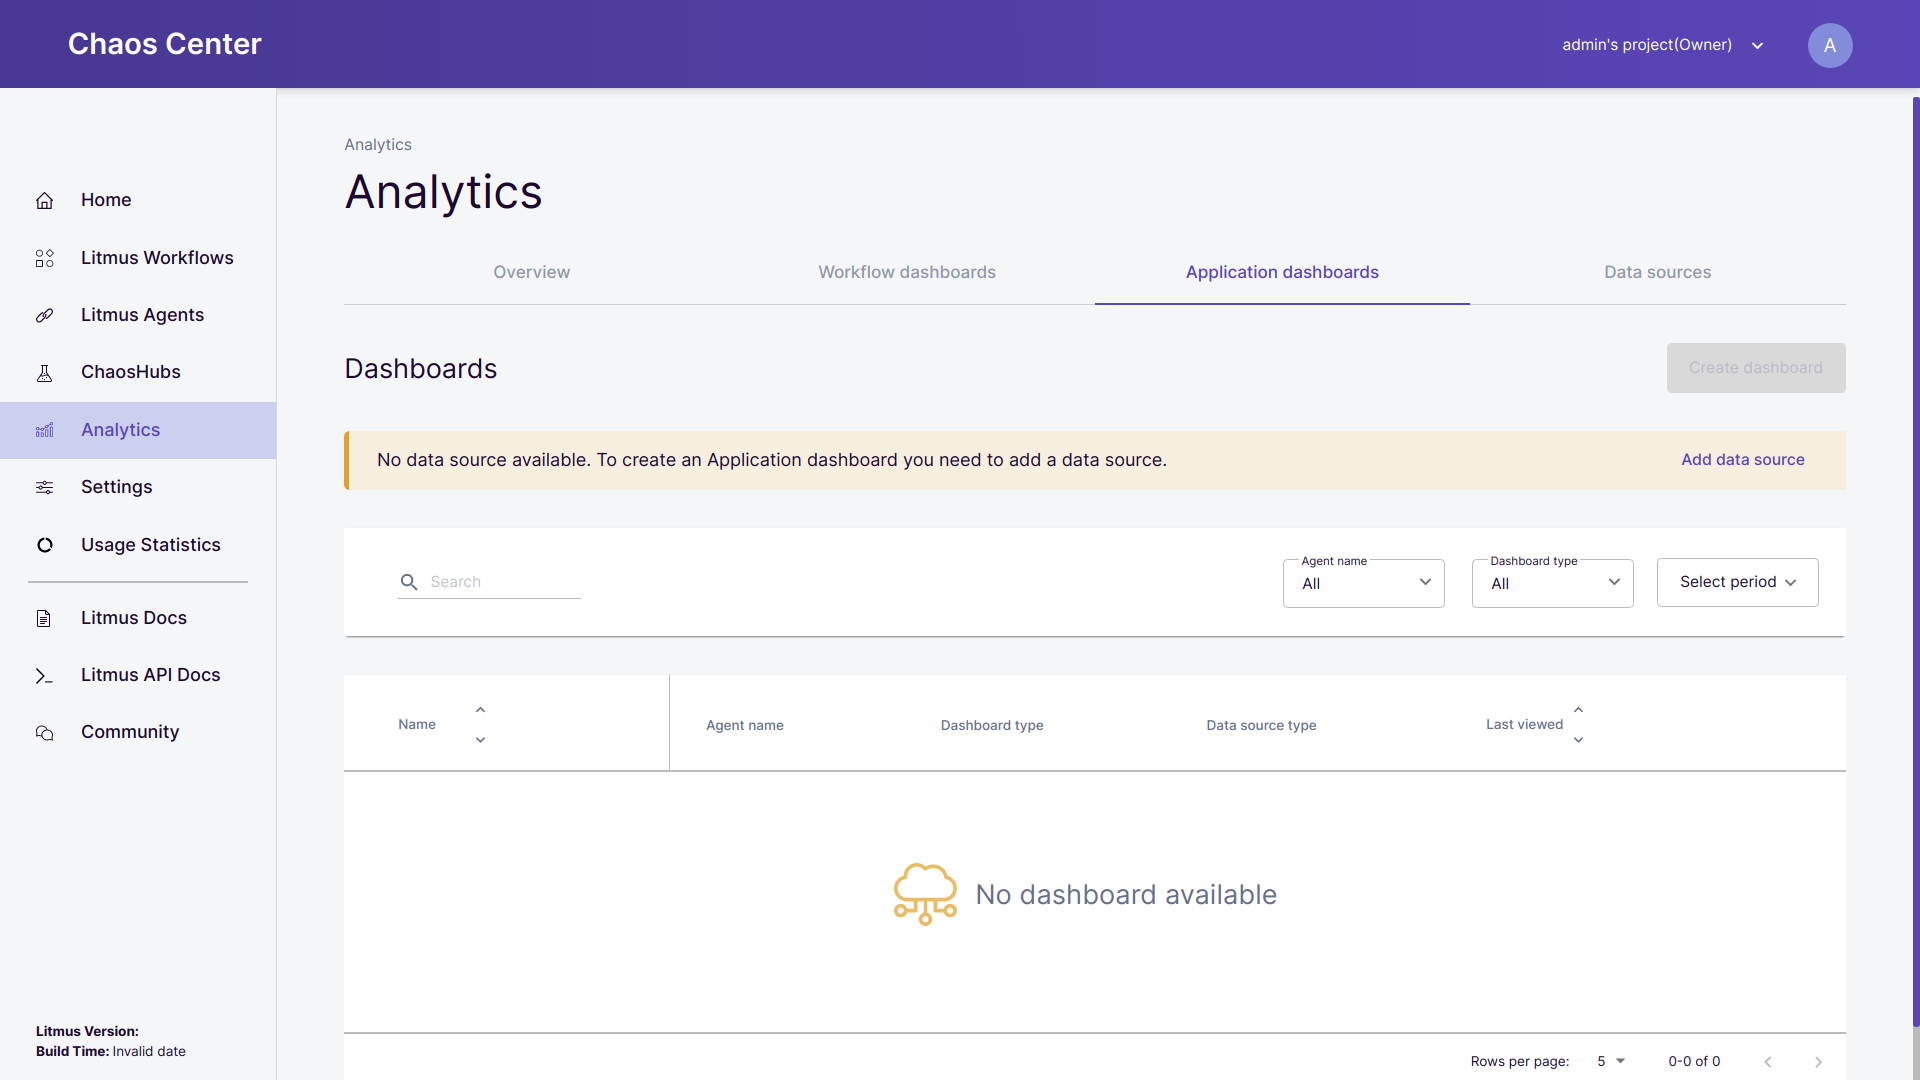 Application dashboard with no configured data source
- If a data source becomes inactive after dashboard creation then you will be requested to either reconfigure the dashboard with another data source or update the existing data source.
Table for configured dashboards
All the configured dashboards are listed under the Dashboards table. The table provides you all the details related to the dashboard like the name of the dashboard, the chaos delegate with which it has been connected, type of the dashboard, connected data source type and the last date it was opened.
For all the dashboards listed in the table, you can filter the dashboard with respect to chaos delegate name, dashboard-type and time period for dashboard creation.
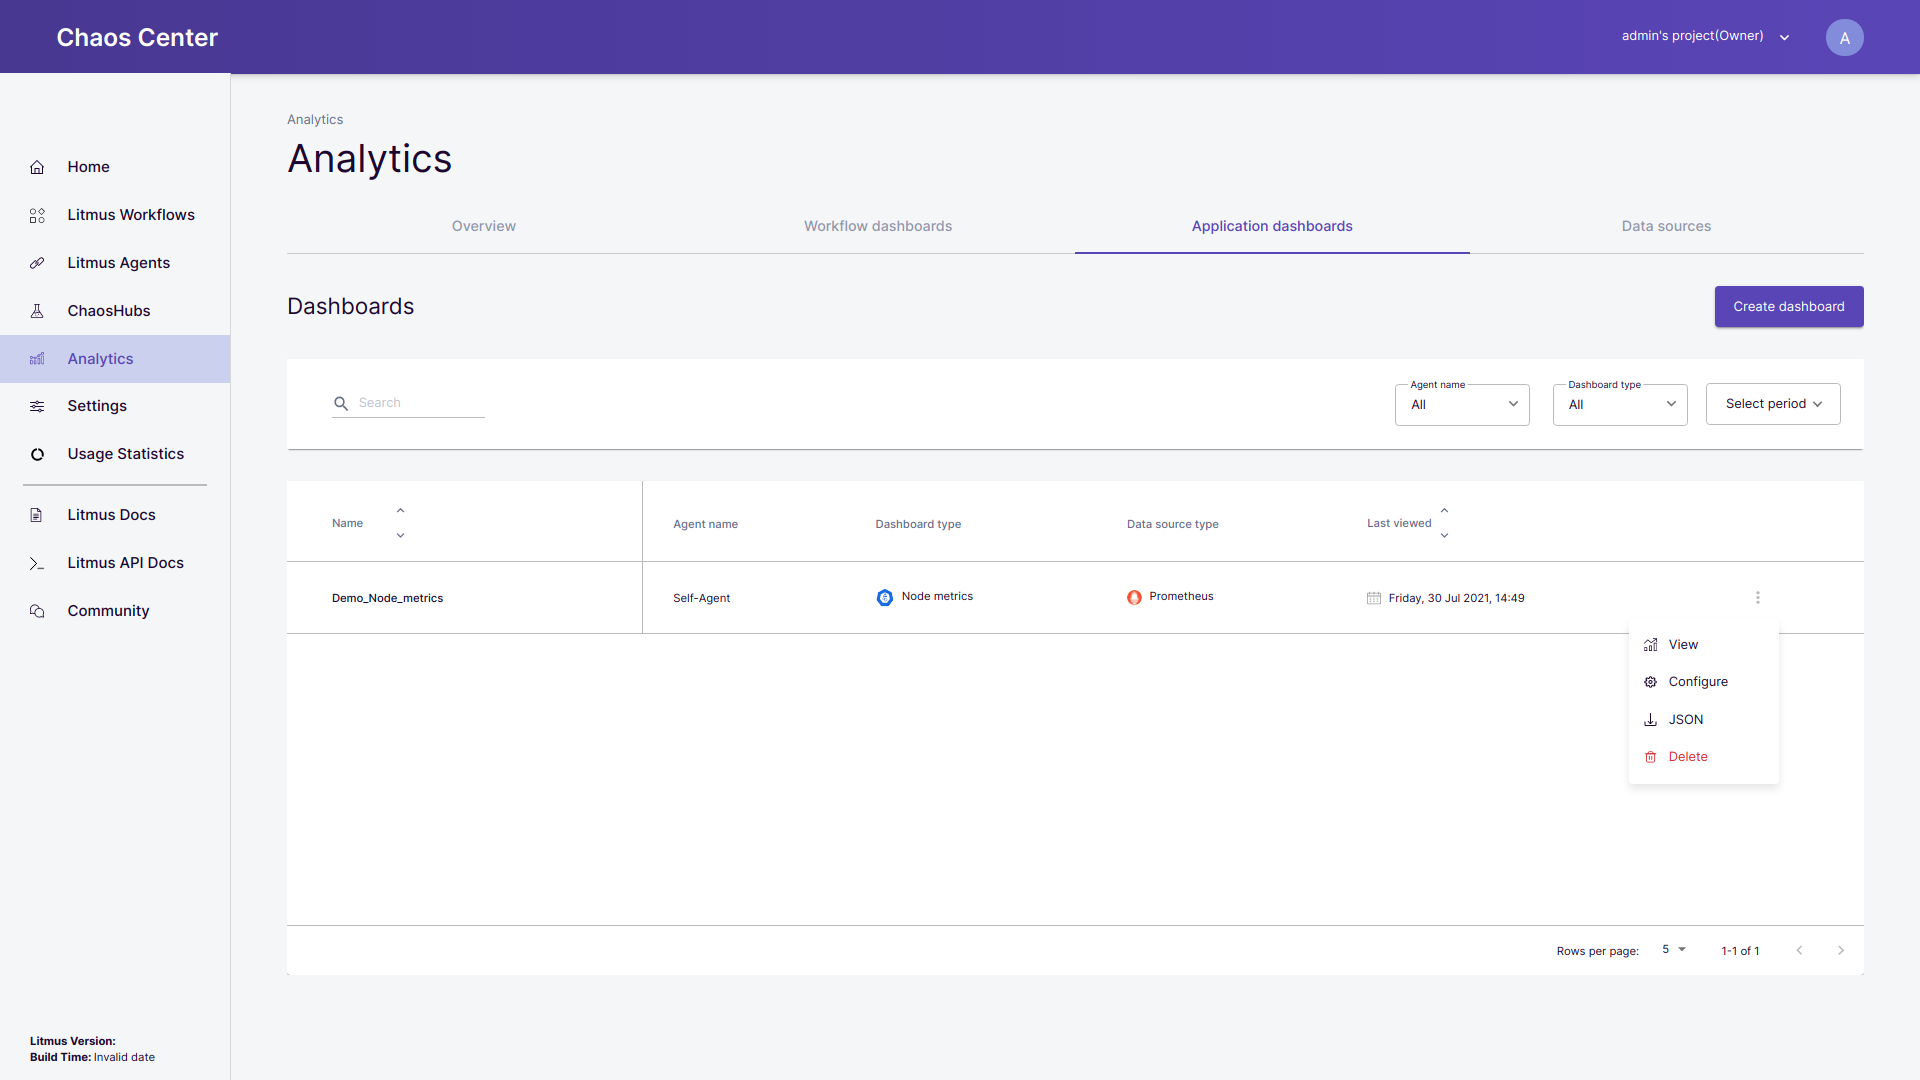 Application dashboard table with a configured dashboard
On clicking on more options, you can select View to open the dashboards, click on configure to make changes in the existing dashboard, you can also download the dashboard in JSON format and click on Delete to remove the dashboard.
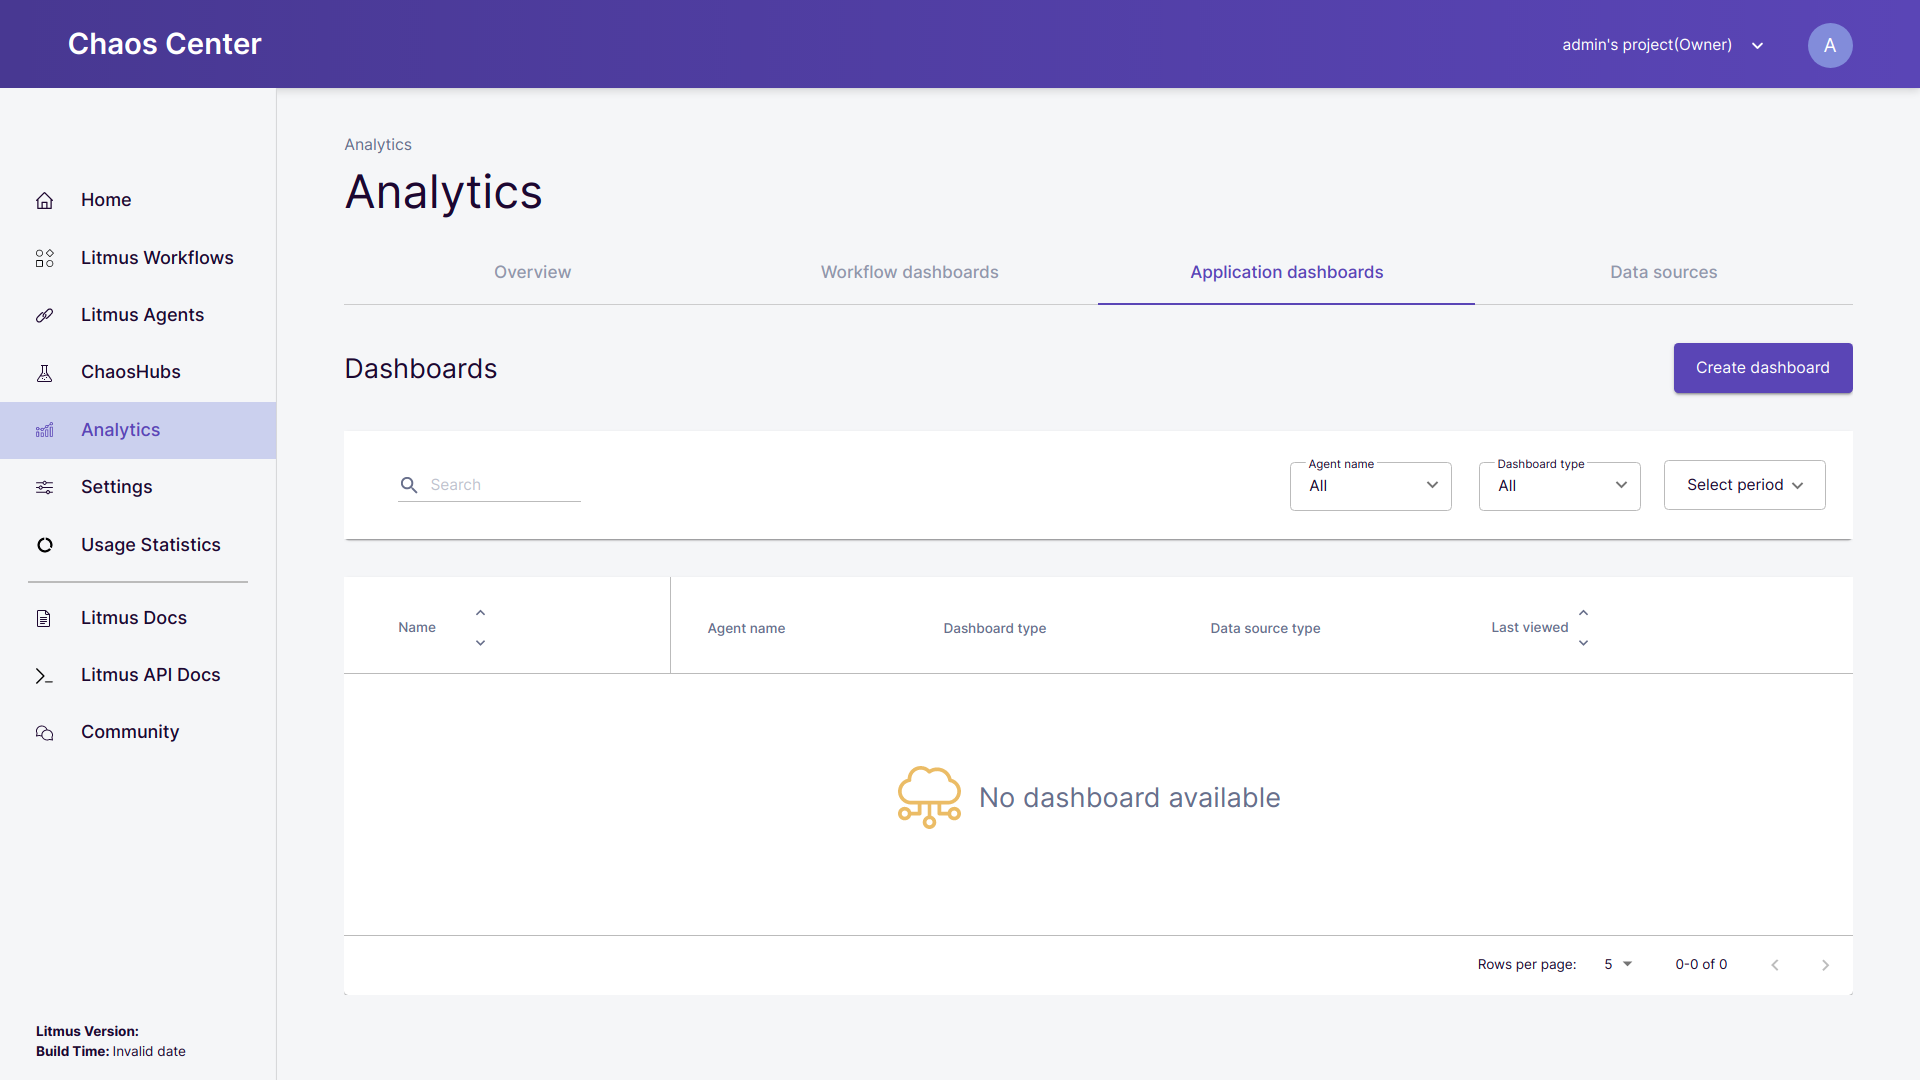
Create dashboard
- To add a dashboard, click on the
Create dashboardbutton placed at the right corner.
 Creating a dashboard
- Choose a dashboard-type:
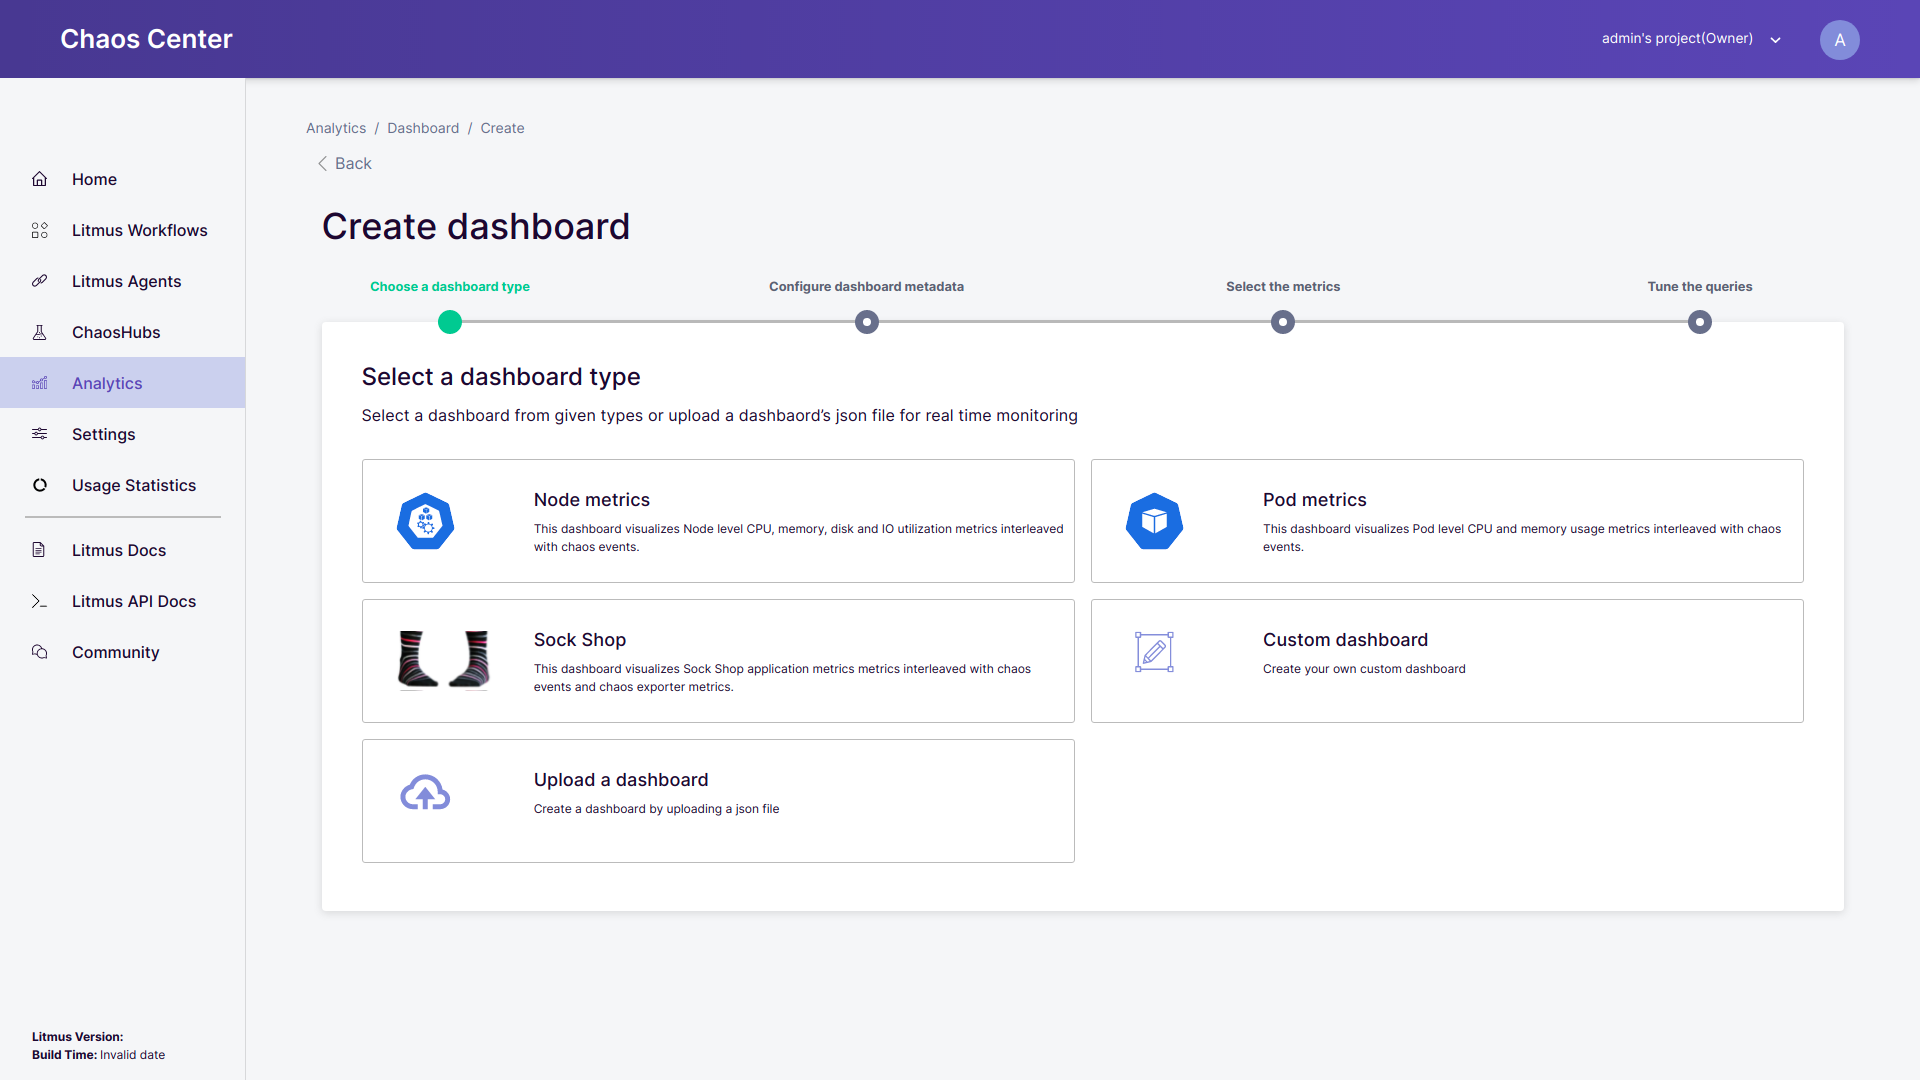 Select dashboard type
You need to select the dashboard type from the following options:
- Predefined dashboards: Litmus provides a set of predefined dashboards for different applications and use-cases like Node metric, Pod metric, Sock Shop etc along with the chaos events and chaos exporter metrics.
- Custom dashboard: To create your custom dashboard from scratch.
- Upload a dashboard: To upload a dashboard in a JSON file format. This option is helpful for users who already have a JSON file for the dashboard configurations.
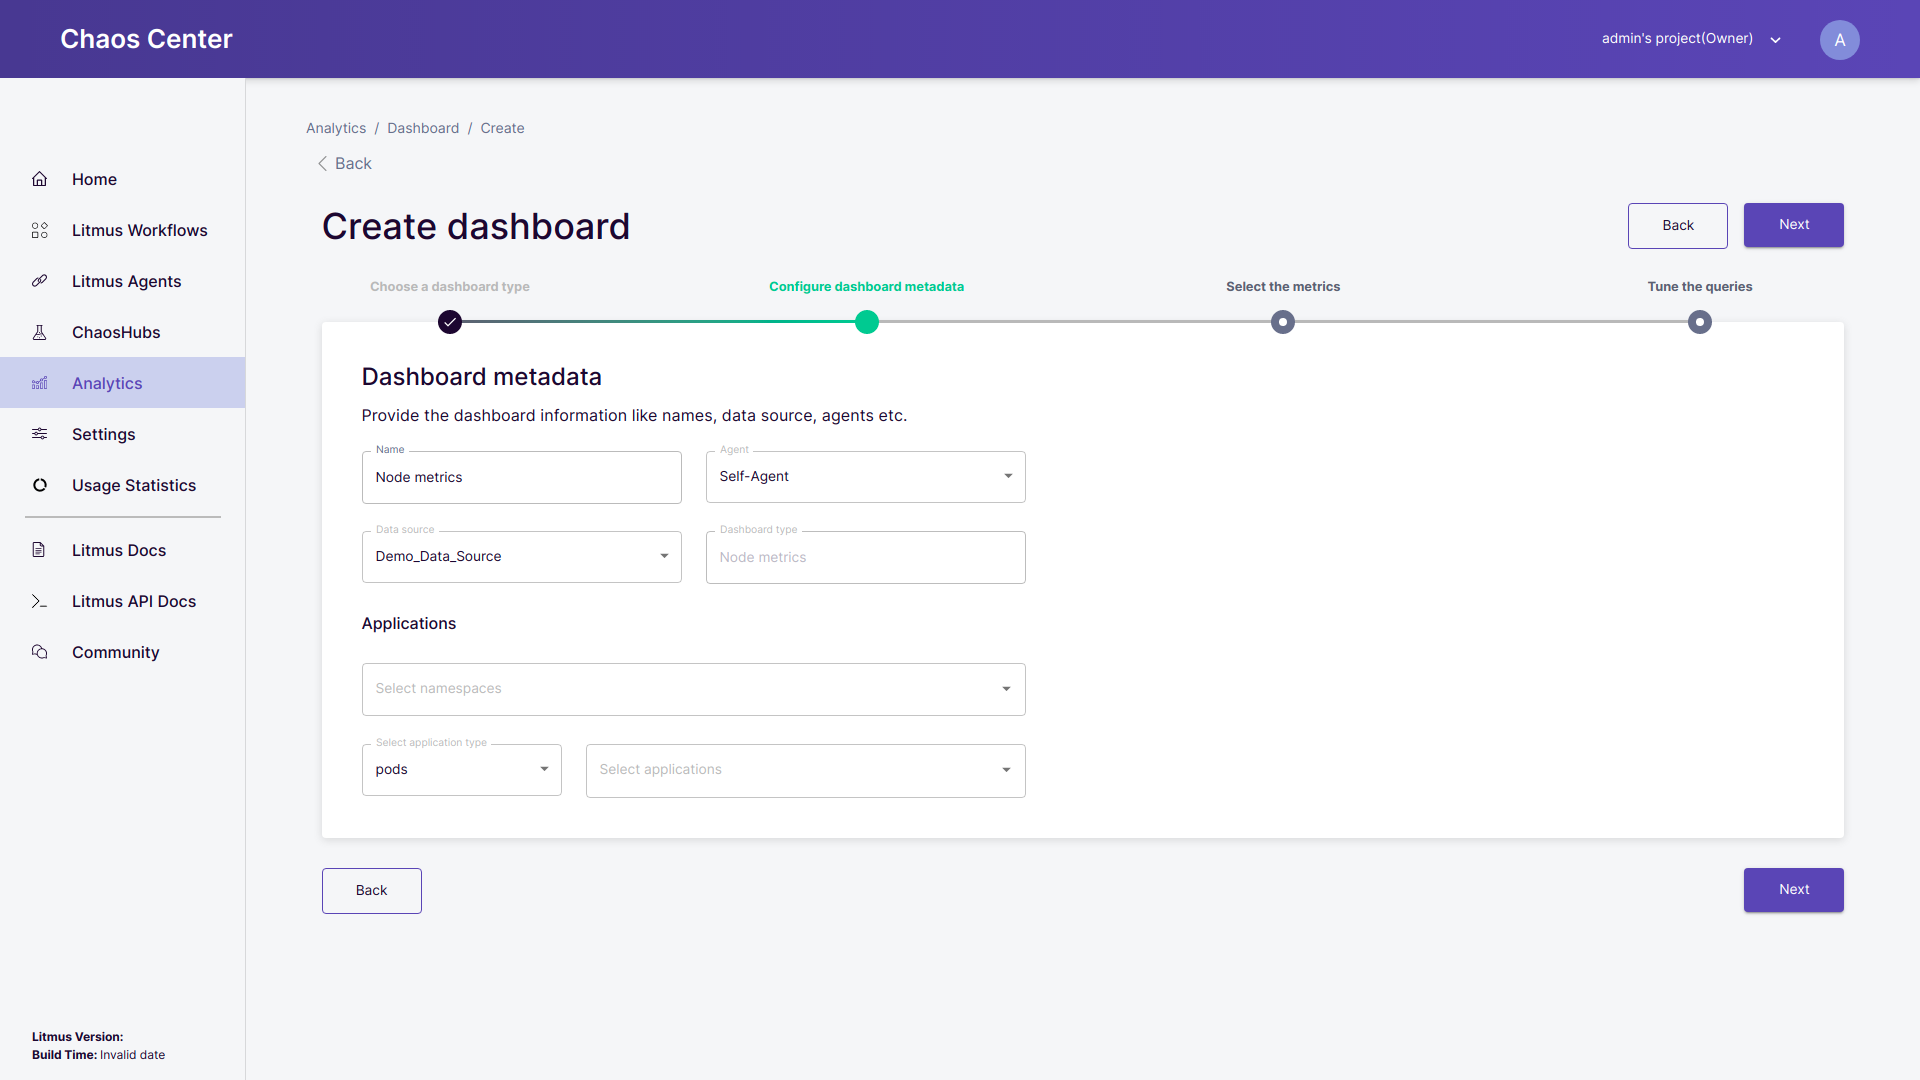 Configuring the metadata of the dashboard
Dashboard metadata:
- Name: Enter the name for your dashboard. A default name for the dashboard is provided you may override it as per your requirement.
- chaos delegate: Select the chaos delegate for which you want to set up the dashboard. By default, an chaos delegate from the list of all connected chaos delegates is selected for you. You may override this as per your requirement.
- Data source: Select the data source from which you want to scrap the metrics and visualise it. By default, a data source from the list of all the active data sources is selected for you. You may override this as per your requirement.
- Dashboard type: It contains information about the type of the dashboard being configured. If you want to change it you may navigate back to
Choose a dashboard typeand select the desired dashboard type. Once the dashboard is created its type cannot be changed. - Applications: You can make selections for particular namespaces, application types and specific applications which will assist you while tuning the queries and visualizing the metrics.
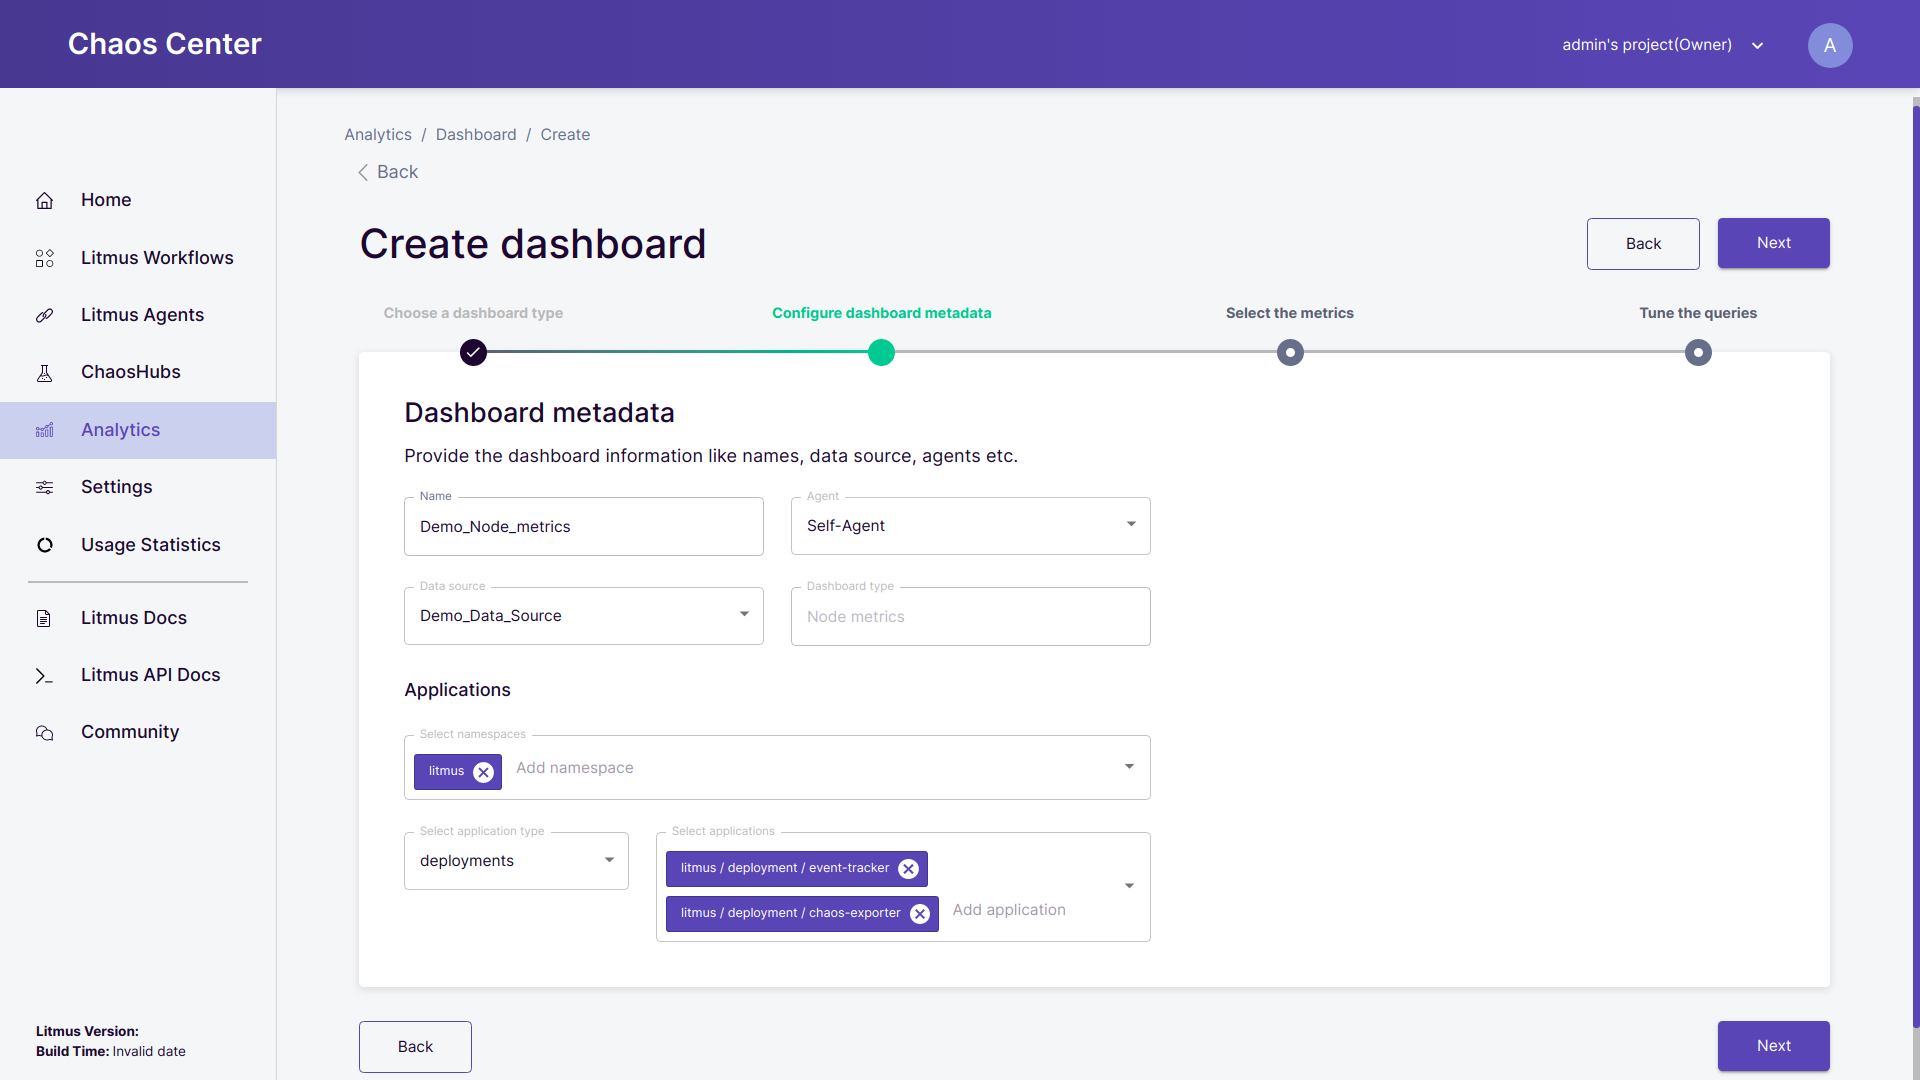 Selecting applications
- Select the metrics: For the predefined dashboards, the checklist of the corresponding metrics is provided from which you may select the required metrics to be plotted.
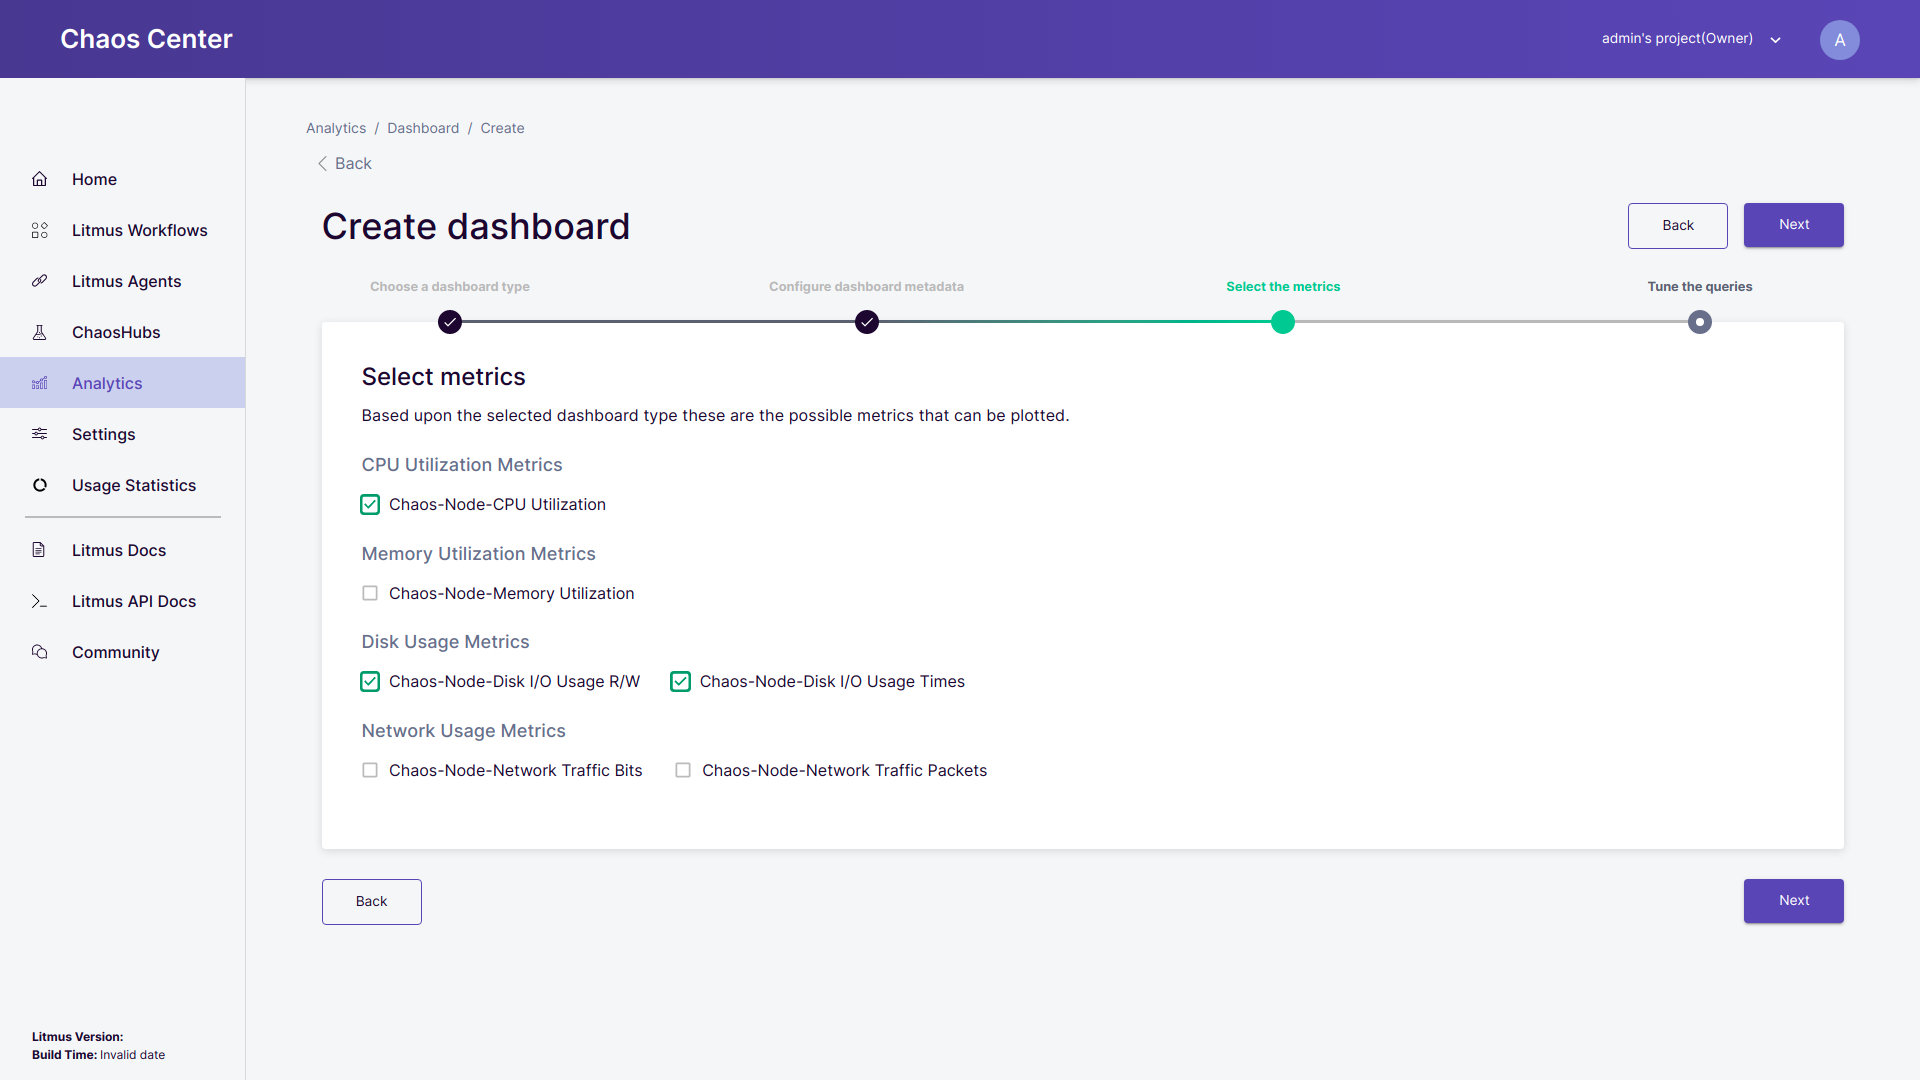 Selecting the required metrics
The dashboards comprise panel groups each having a set of panel metrics. For example here, CPU Utilization Metrics is the panel group and Chaos-Node-CPU Utilization is the panel metric.
- Tune the queries: Tuning the queries is an optional step. If you want to continue with the default set of queries then click on Save Changes and the dashboard will be created. To learn more about tuning the queries click here.