Viewing Chaos Impact on Applications Metrics Across Chaos Delegate ’s Scope
After creating a dashboard, you view the corresponding metrics along with the chaos events in order to understand the impact of the chaos on various applicatons.
 Viewing particular application dashboard
Dashboard Navigation
- Dashboard Info: All the dashboard meta-data (name, type, data source, chaos delegate ), selected applications and selected panels are displayed in this selection. To check on the data source connected with the dashboard click on the attached data source link. You may select/deselect the items listed in the selected applications and selected panels field to visualize the appropriate data.
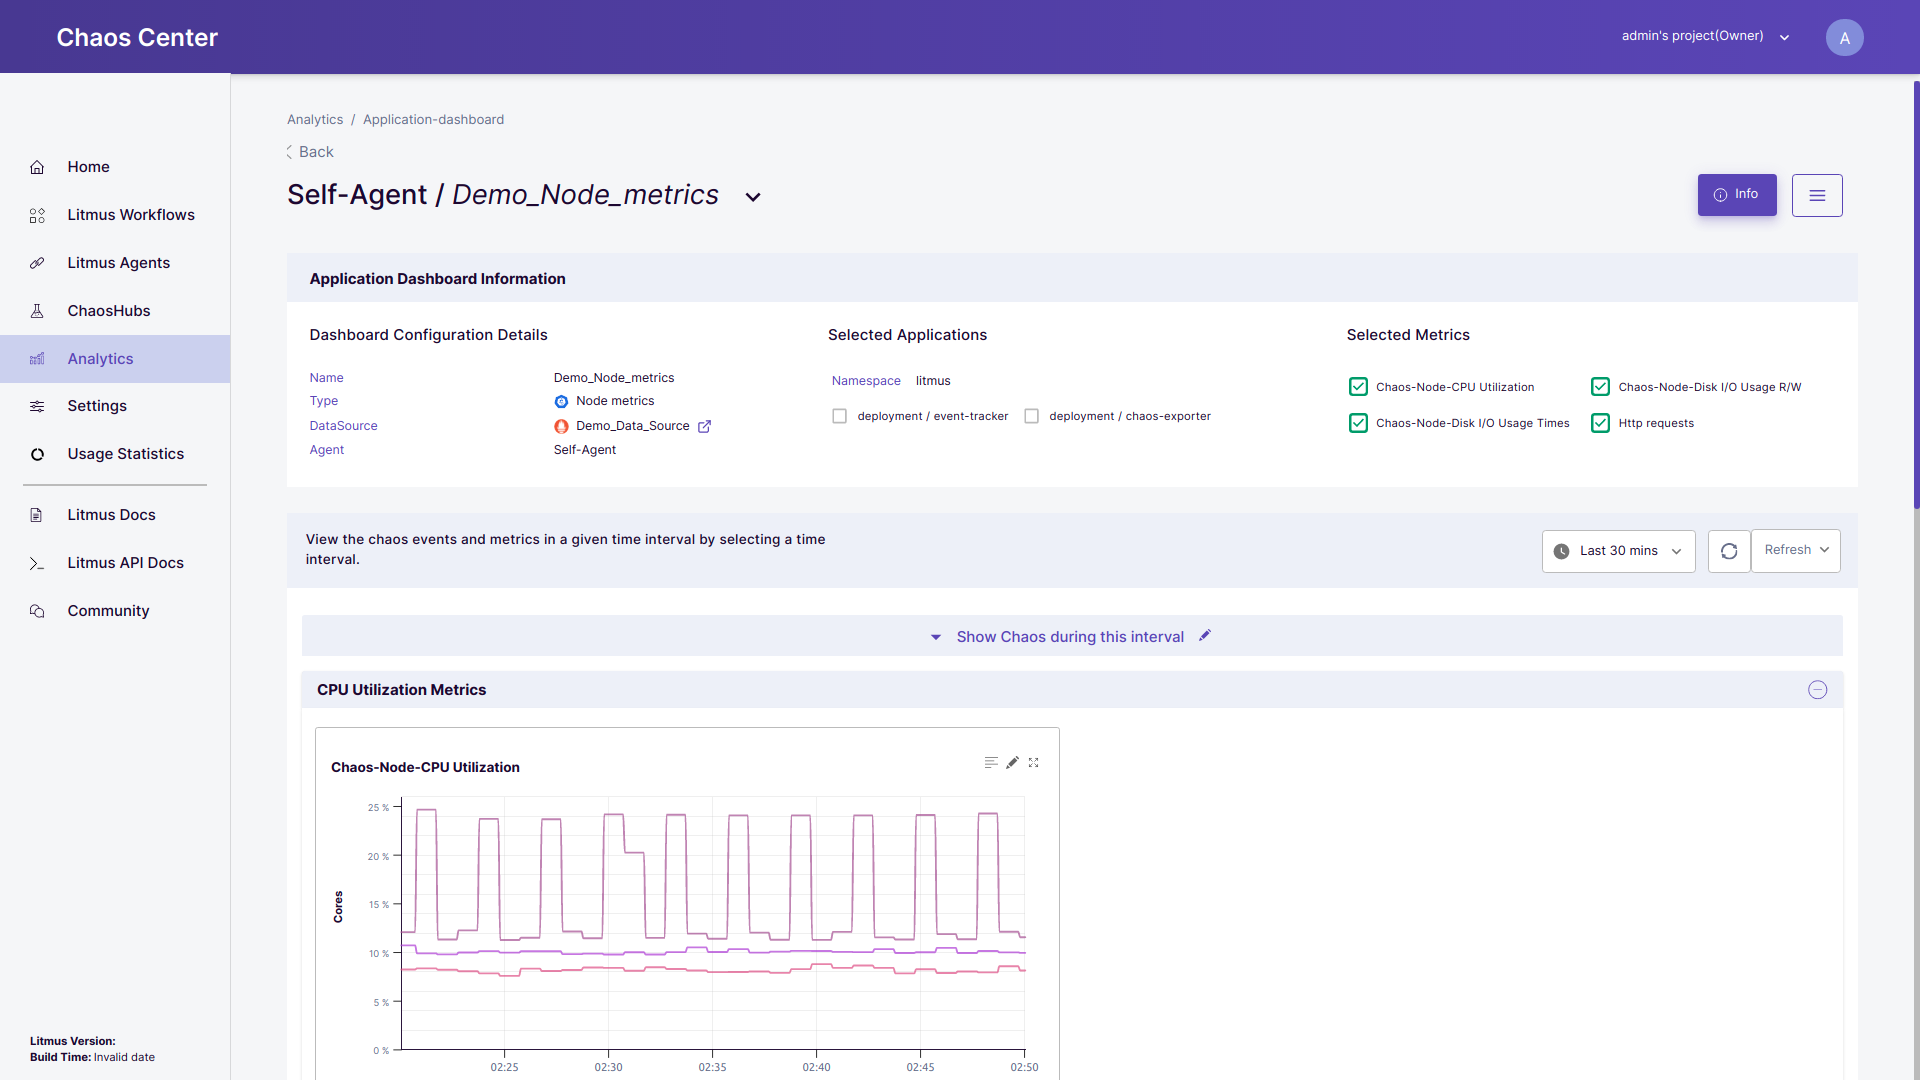 Viewing the information related to the dashboard
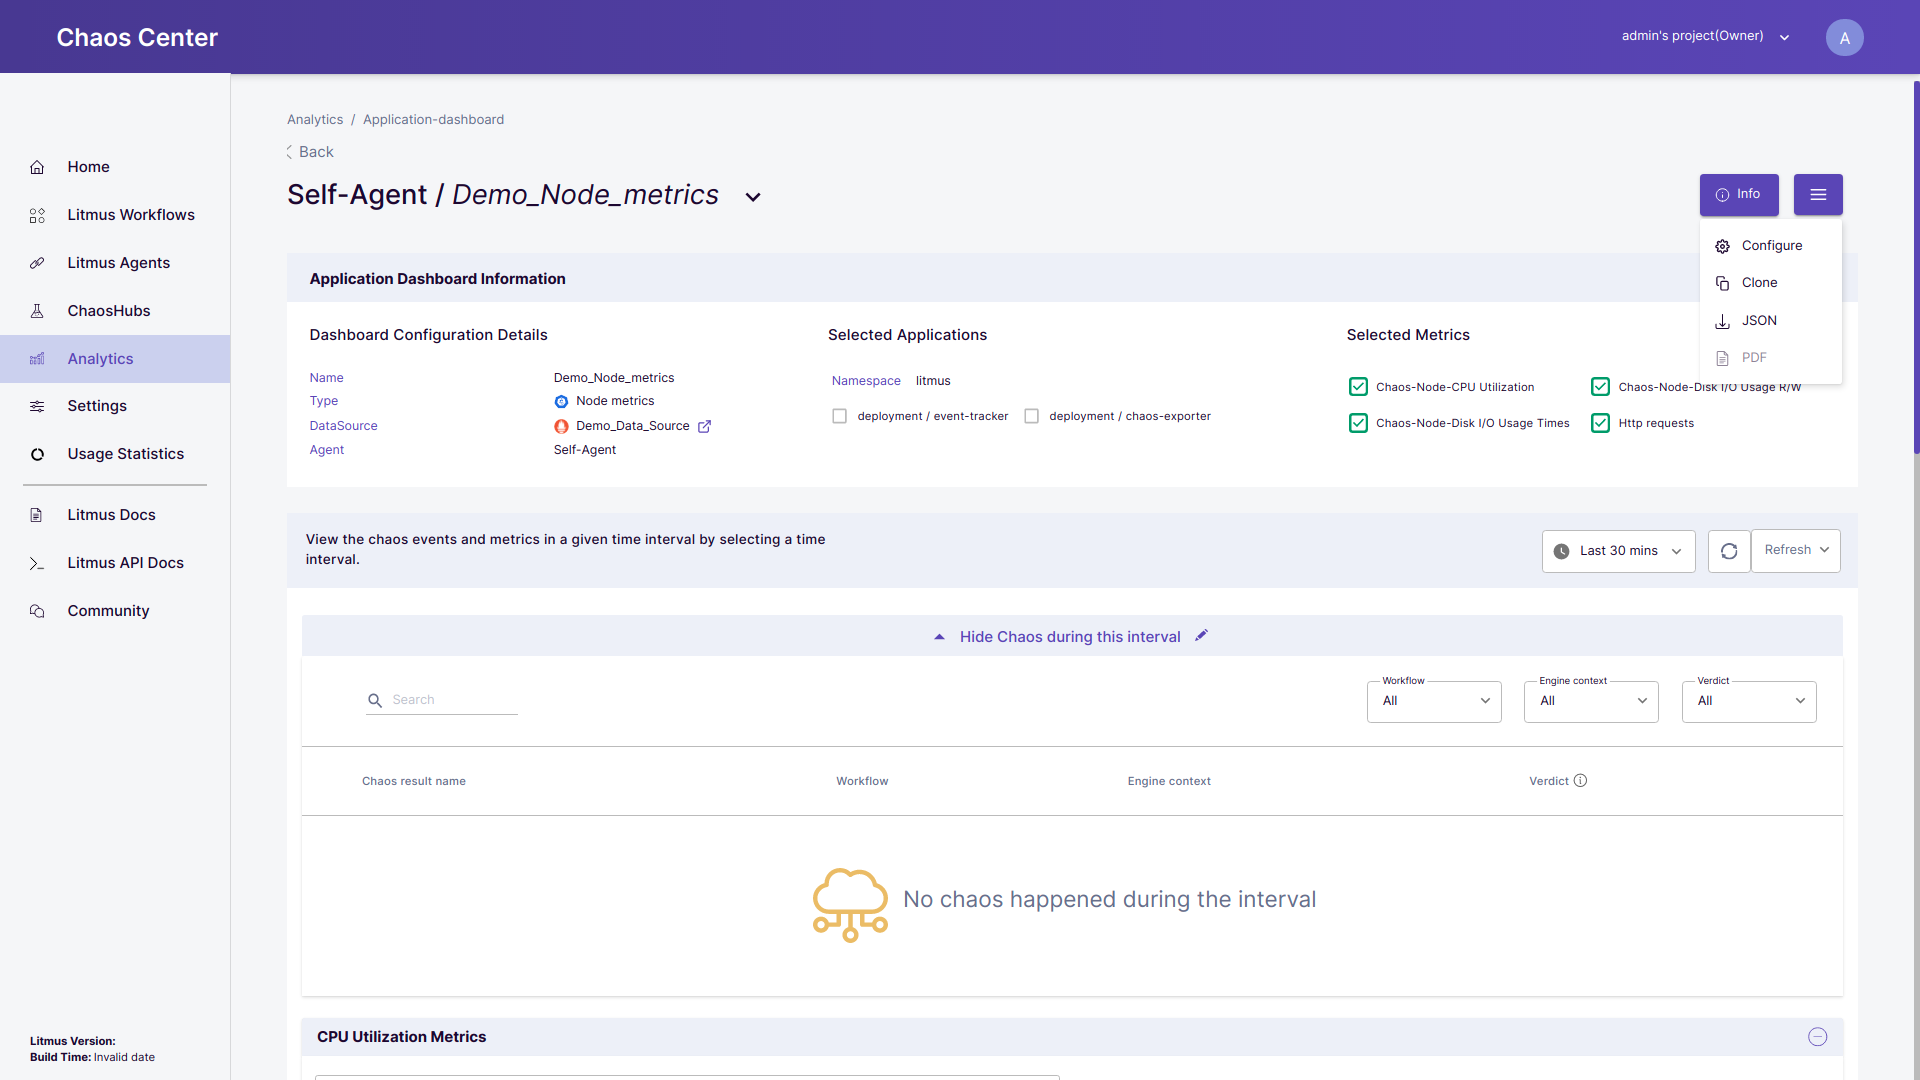 Viewing more options
More Options:
Configure: To make changes in the metadata and/or fine-tune the queries. To learn about configuring a dashboard click here.
Clone: To make a copy of the current dashboard click on the clone button. Enter new name of the dashboard and click on
okDownload a JSON: To download the complete dashboard configuration in JSON format.
PDF report: For downloading all the metric data in report format with graphs and summary. This feature is under development and will be made available in an upcoming version.
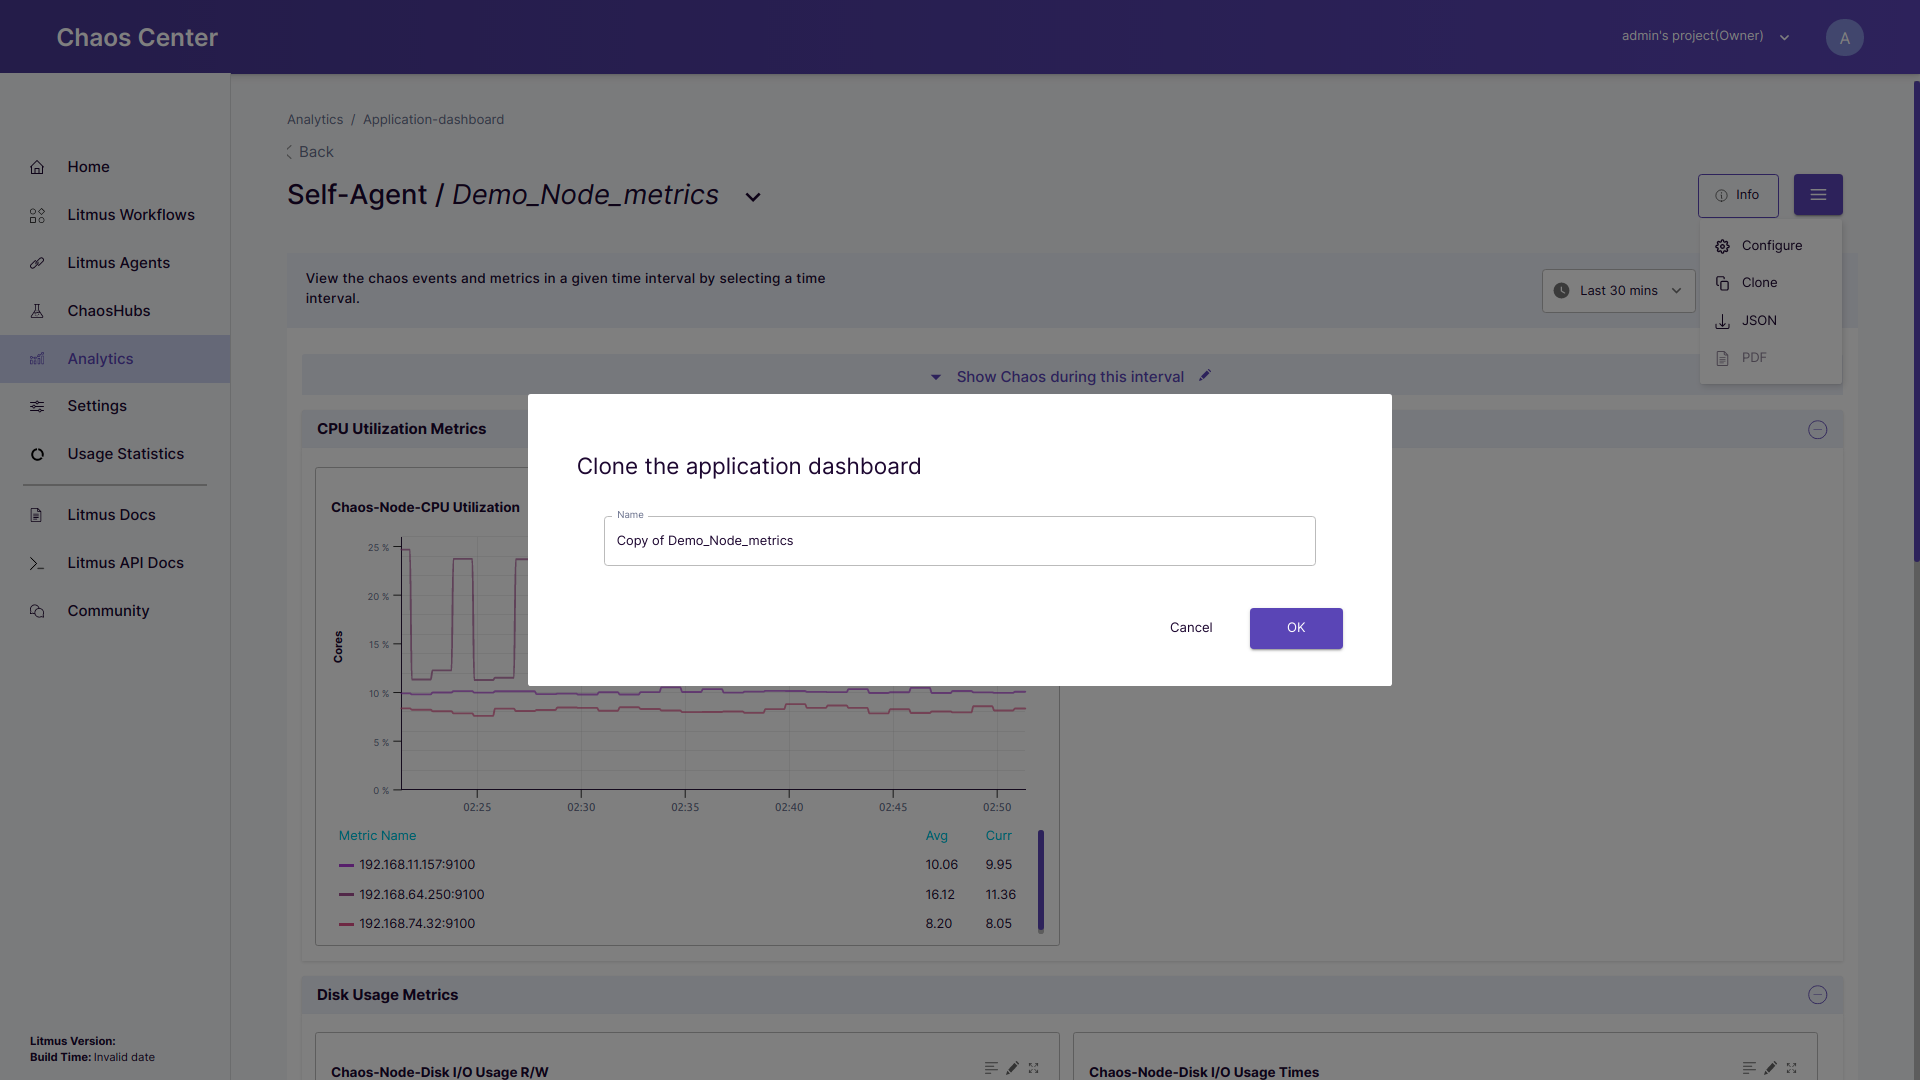 Creating a copy of the dashboard
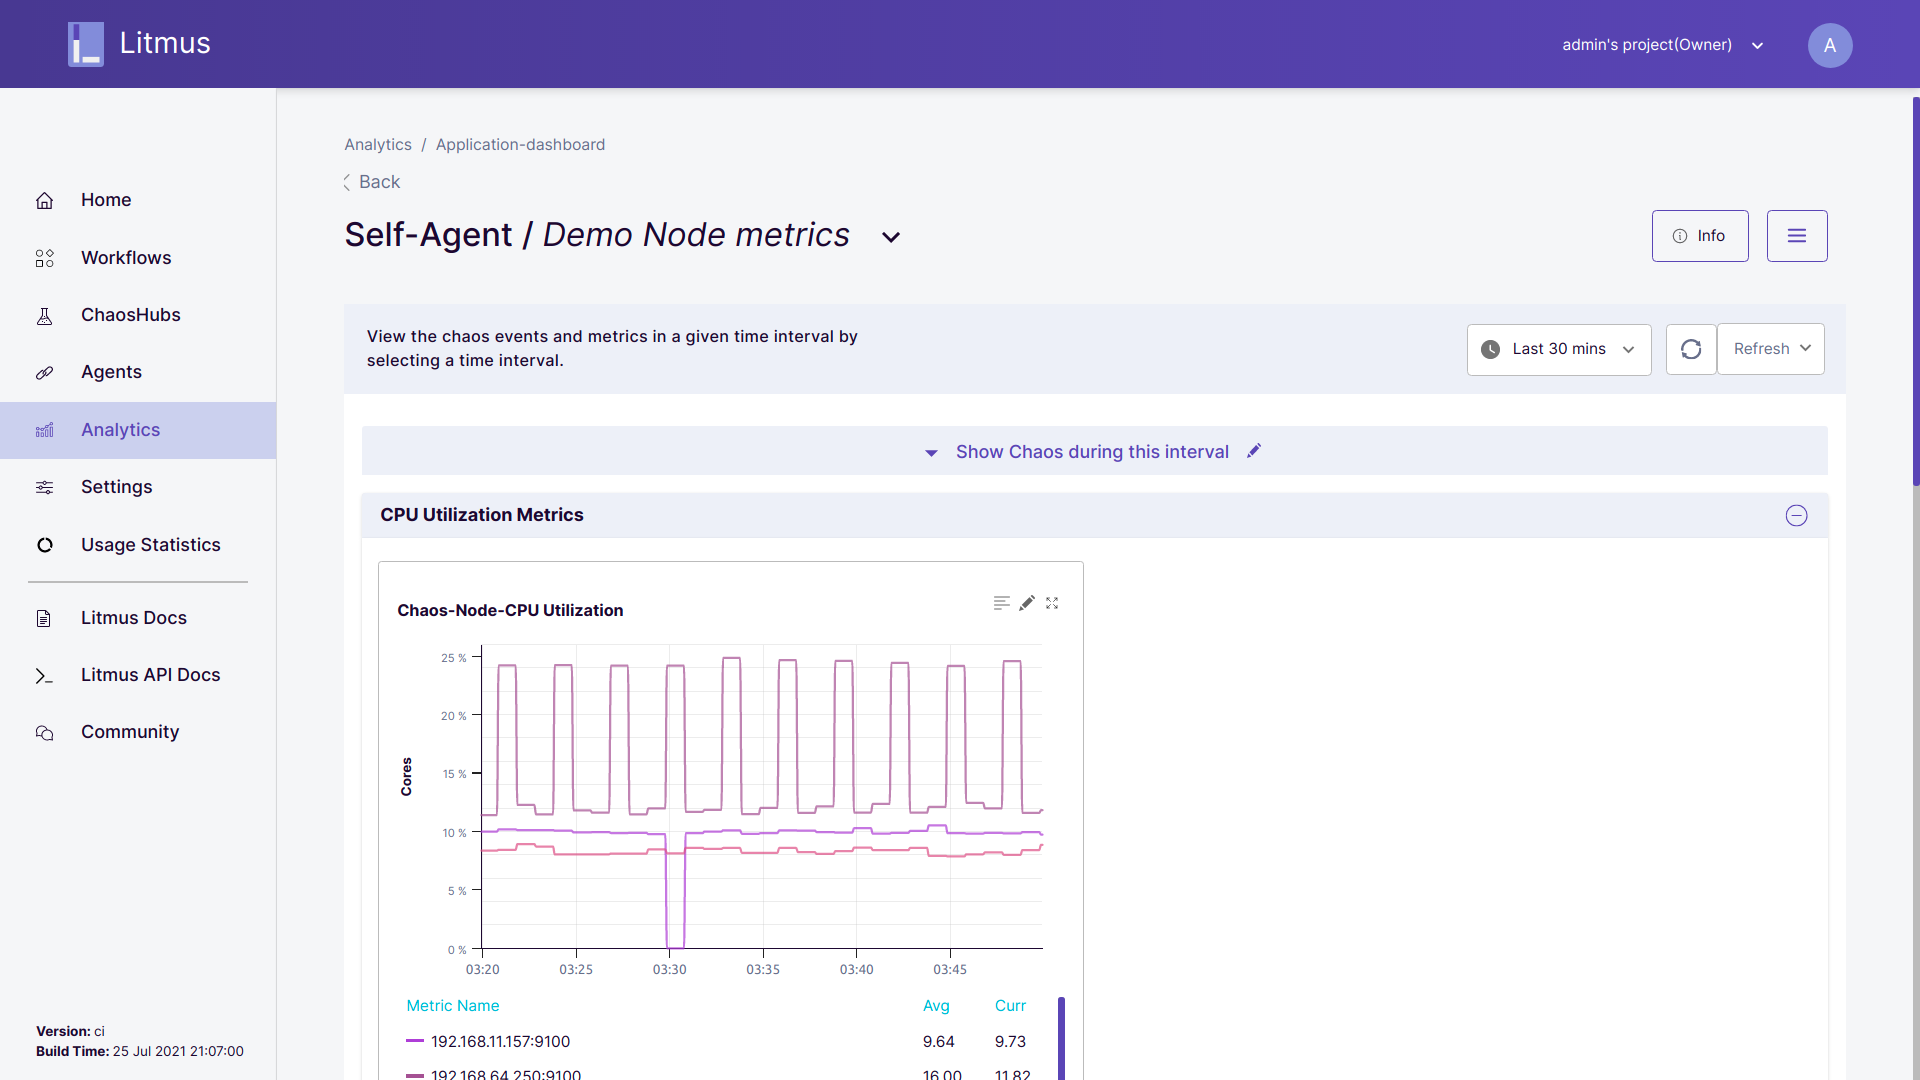
Select a time interval: To visualize the metric data for a specific period, you may select the date and time for the start and end of the interval.
Refresh rate: As the metrics data for a given data source is updated so to query and update all the graphs on the dashboard you may provide a refresh rate. By default, the refresh rate is set at 15 seconds.
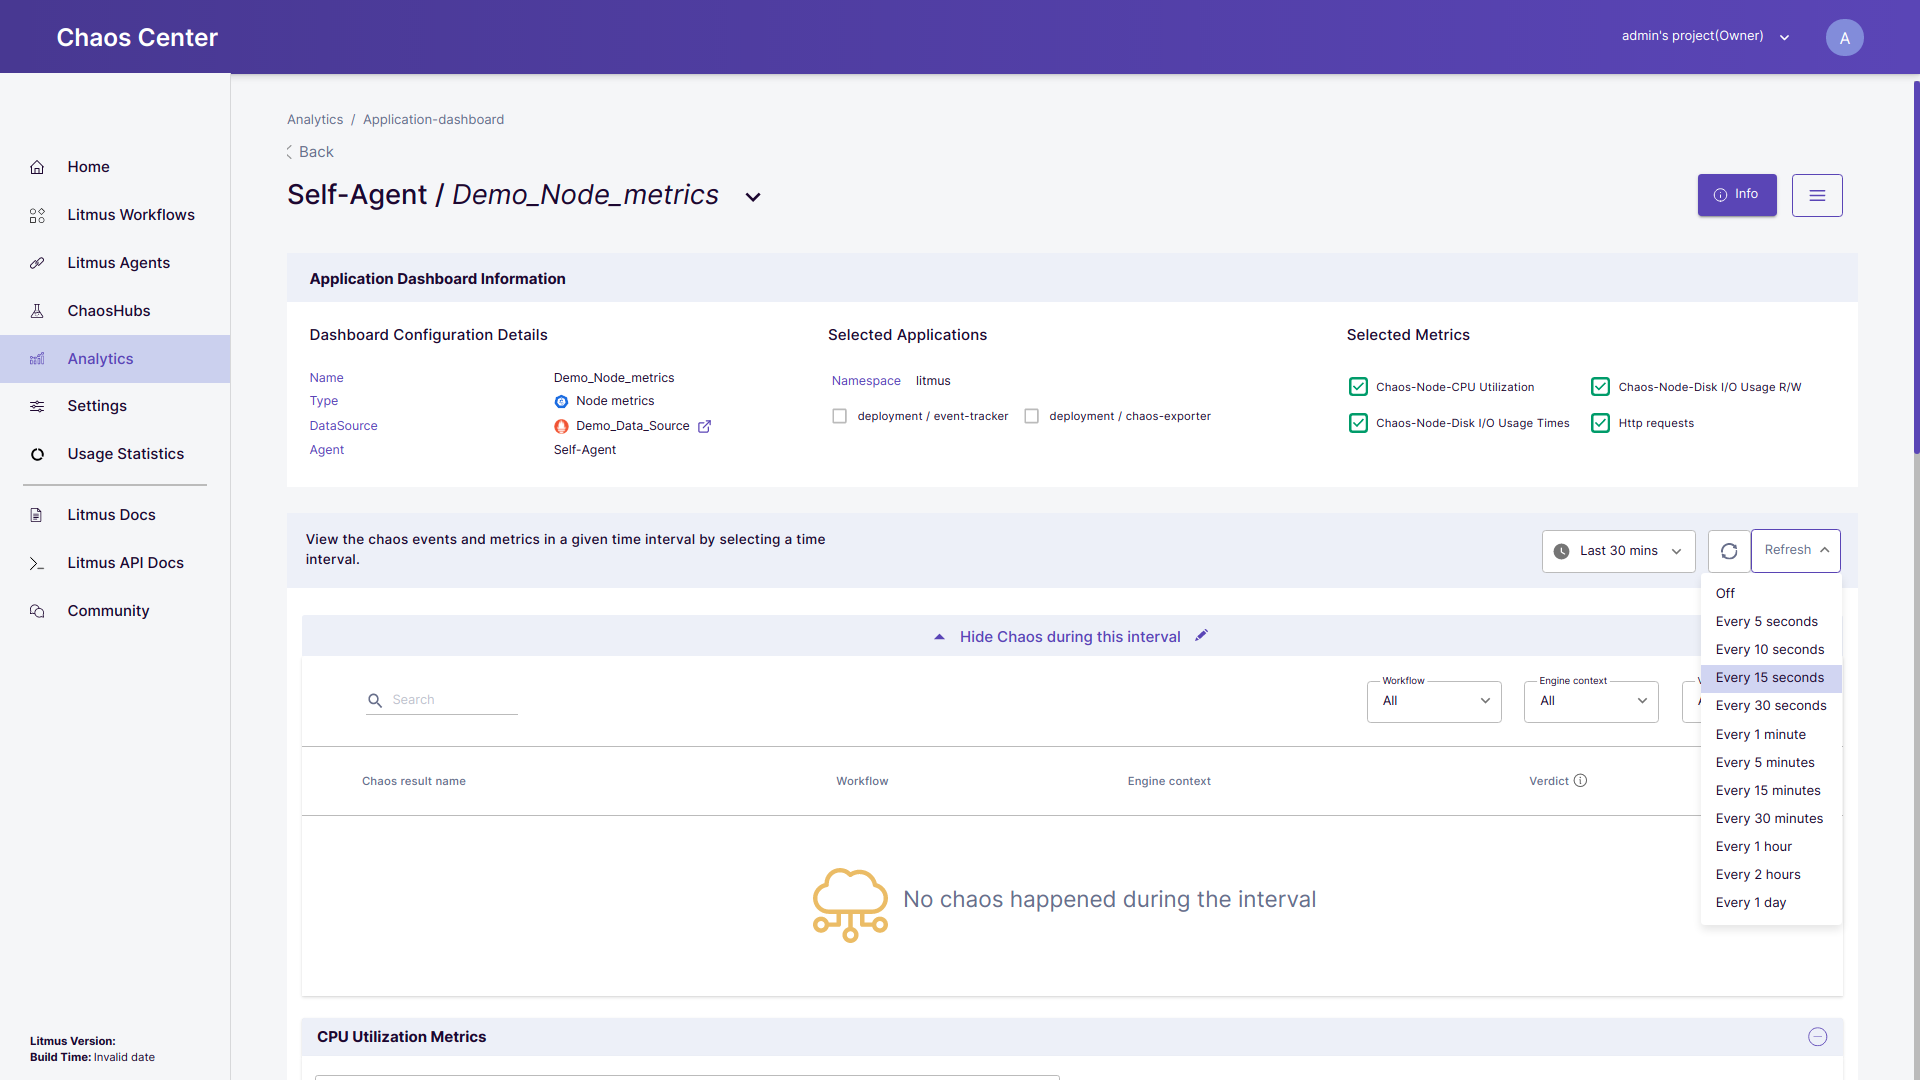 Setting up refersh rate for the dashboard
Hard Refresh: To perform a refresh explicitly a hard refresh option is given to the user.
View chaos metric info: For the particular graph, if you want to view the chaos scenario -related information in the table then you may first expand the graph and hover over the specific chaos event to view all its chaos scenario -related information.
Popout: To open the particular graph in a modal.
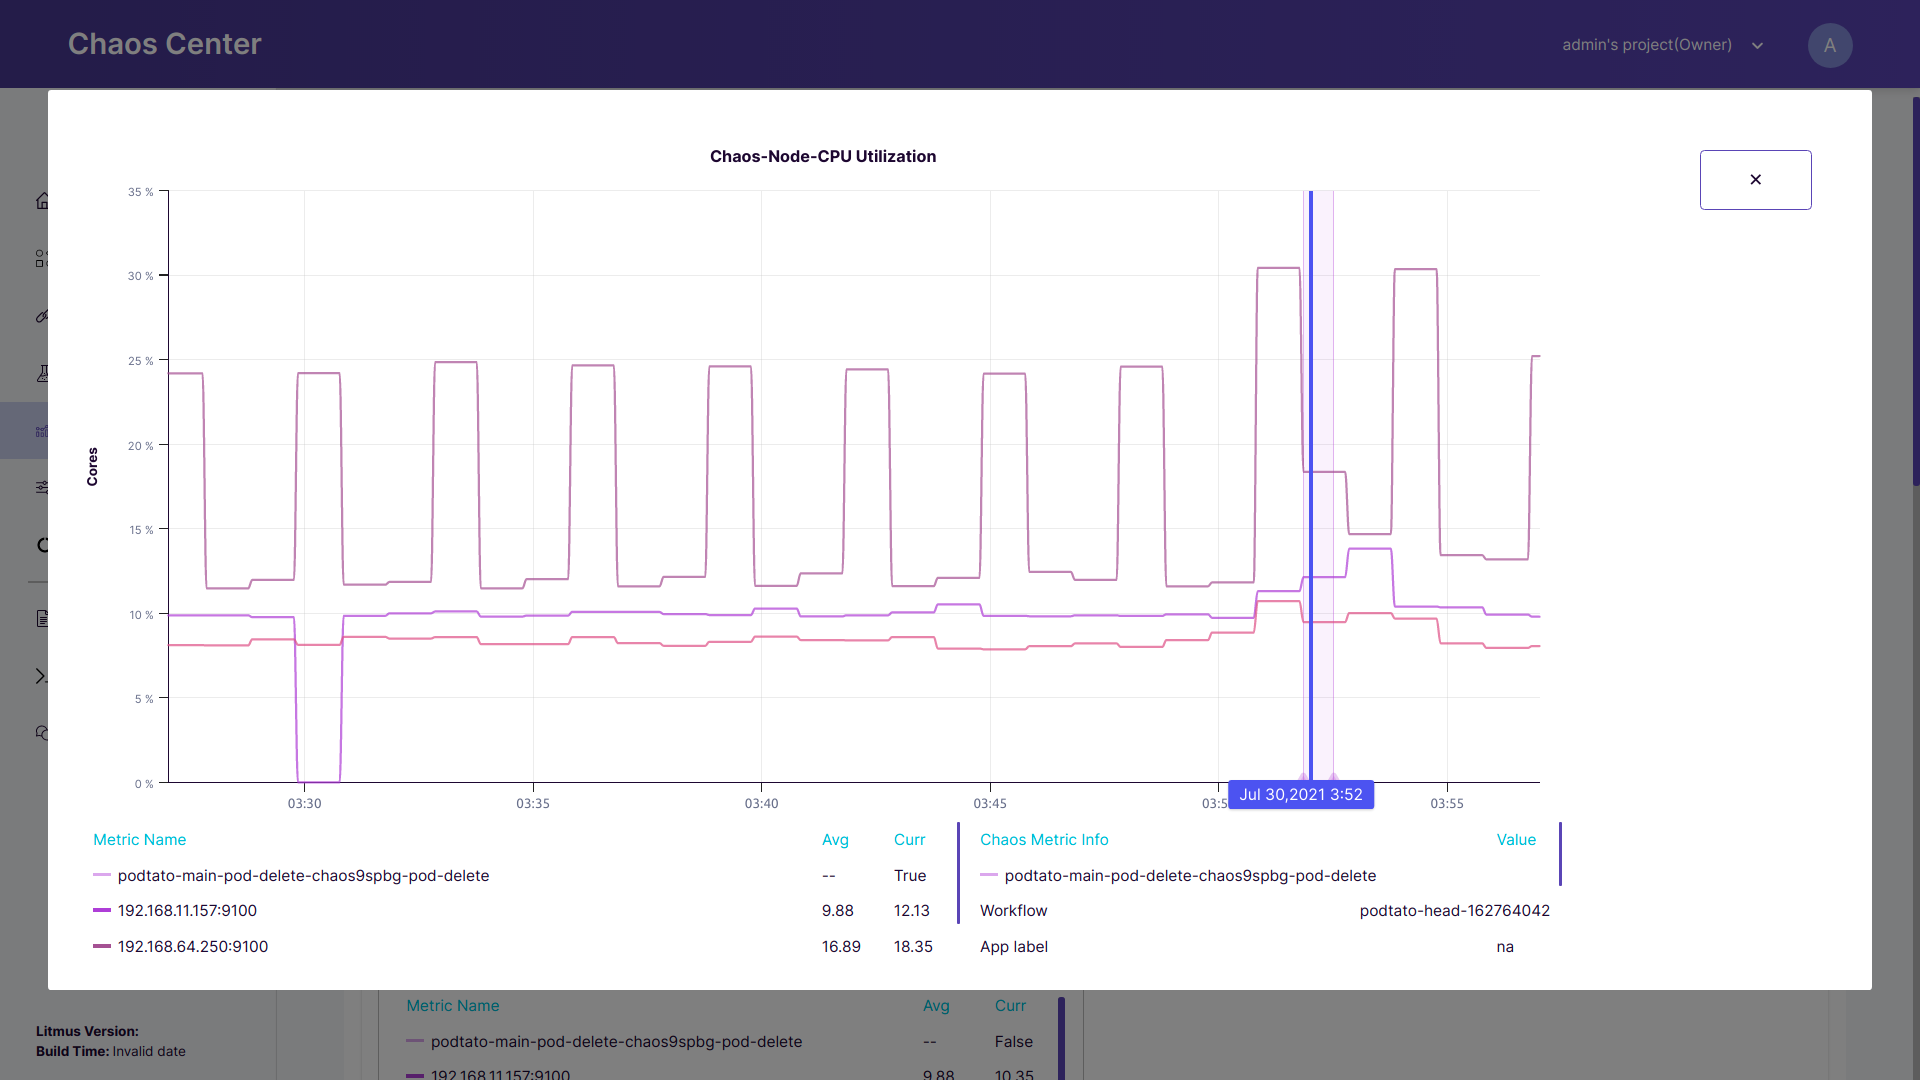 View individulal graph in modal
Edit particular panel: To edit the queries for the specific panel. On clicking on the
Editbutton you will be directed to the dashboard configuration page where you can tune the queries. To learn more about query editing click here.Show chaos during this interval: Among all the chaos injections that have been scheduled by the user, chaos events that lie within the selected time interval are listed in form of a table. You may select/deselect the specific chaos events to visualize them on the graphs as an overlay for the chaos during. Please note that all the chaos events come along with the lasted verdict corresponding to the chaos scenario .
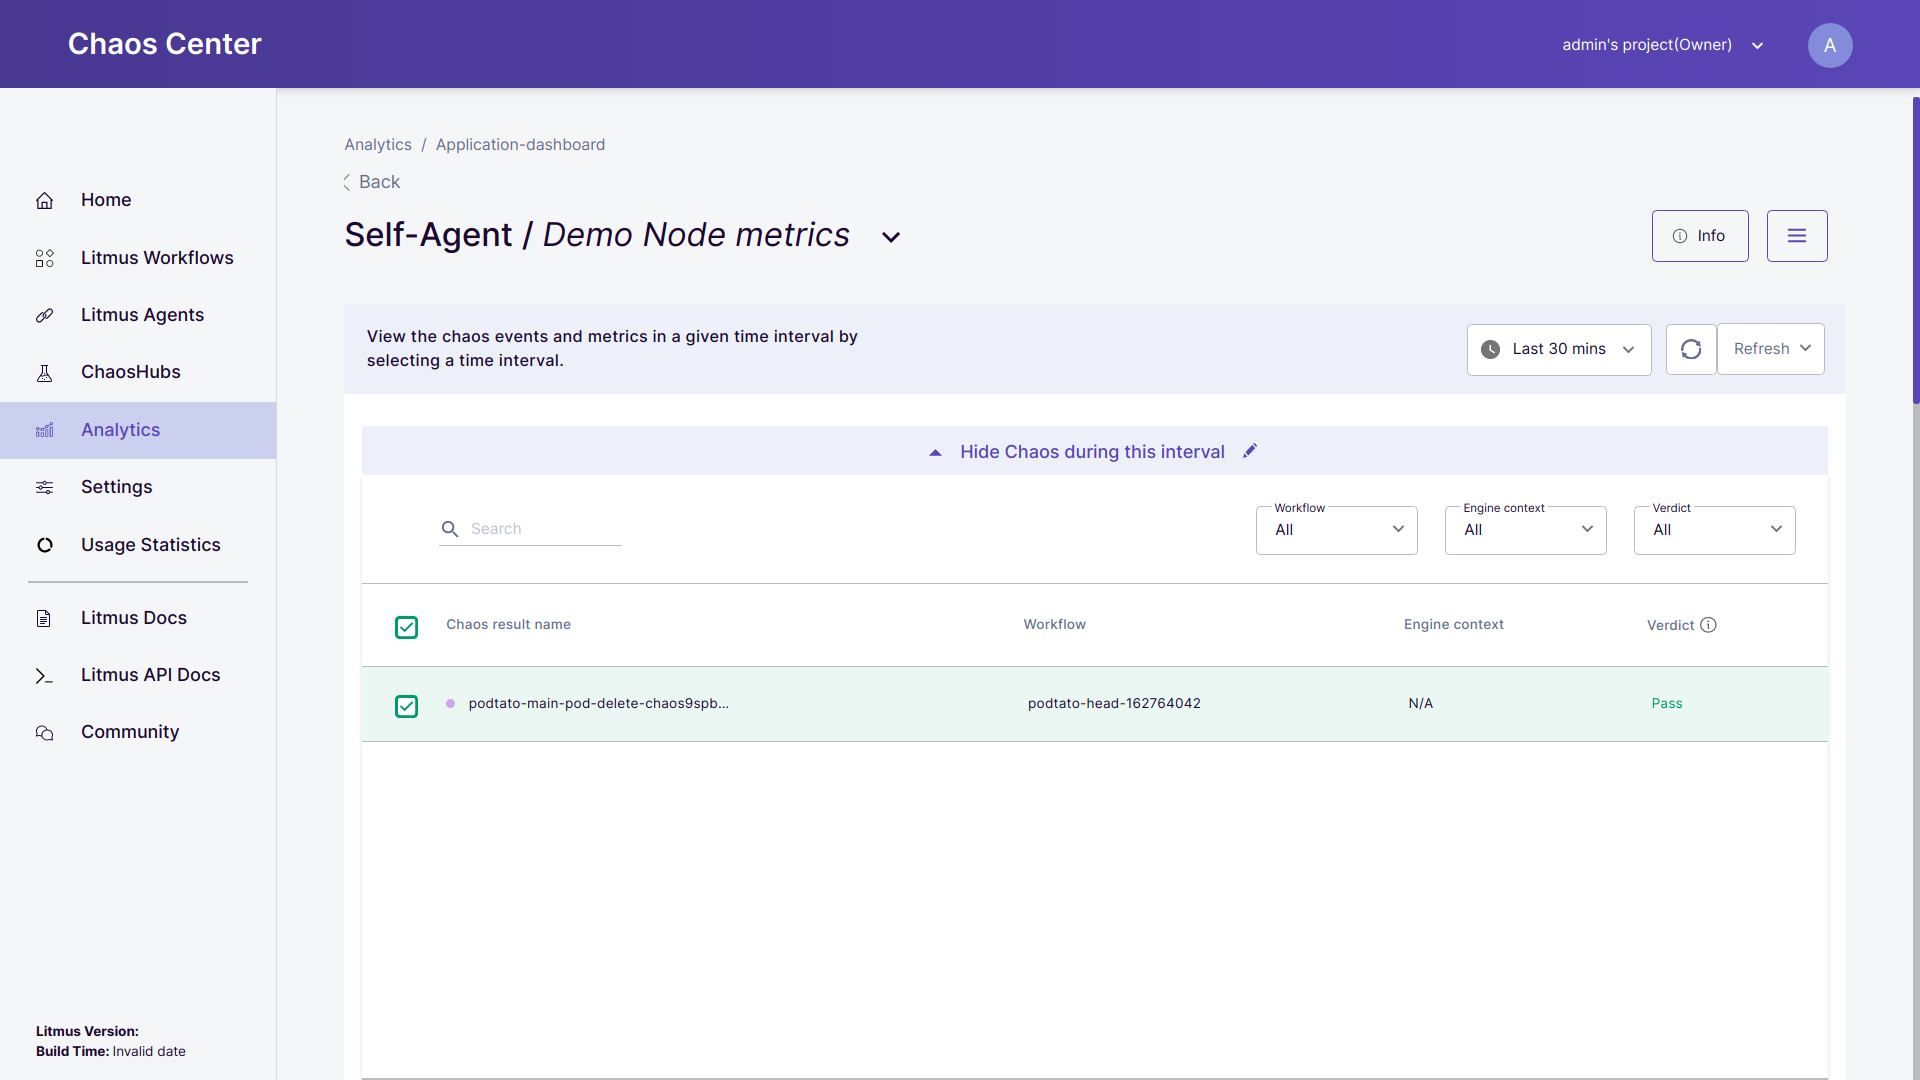 Selecting/deselecting chaos metric
- Edit: Click to edit the chaos annotations.
- Event query: Queries related to the chaos injection events. You may edit them as per your requirement.
- Verdict query: Query related to the verdict/results of the chaos injection. You may edit them as per your requirement.
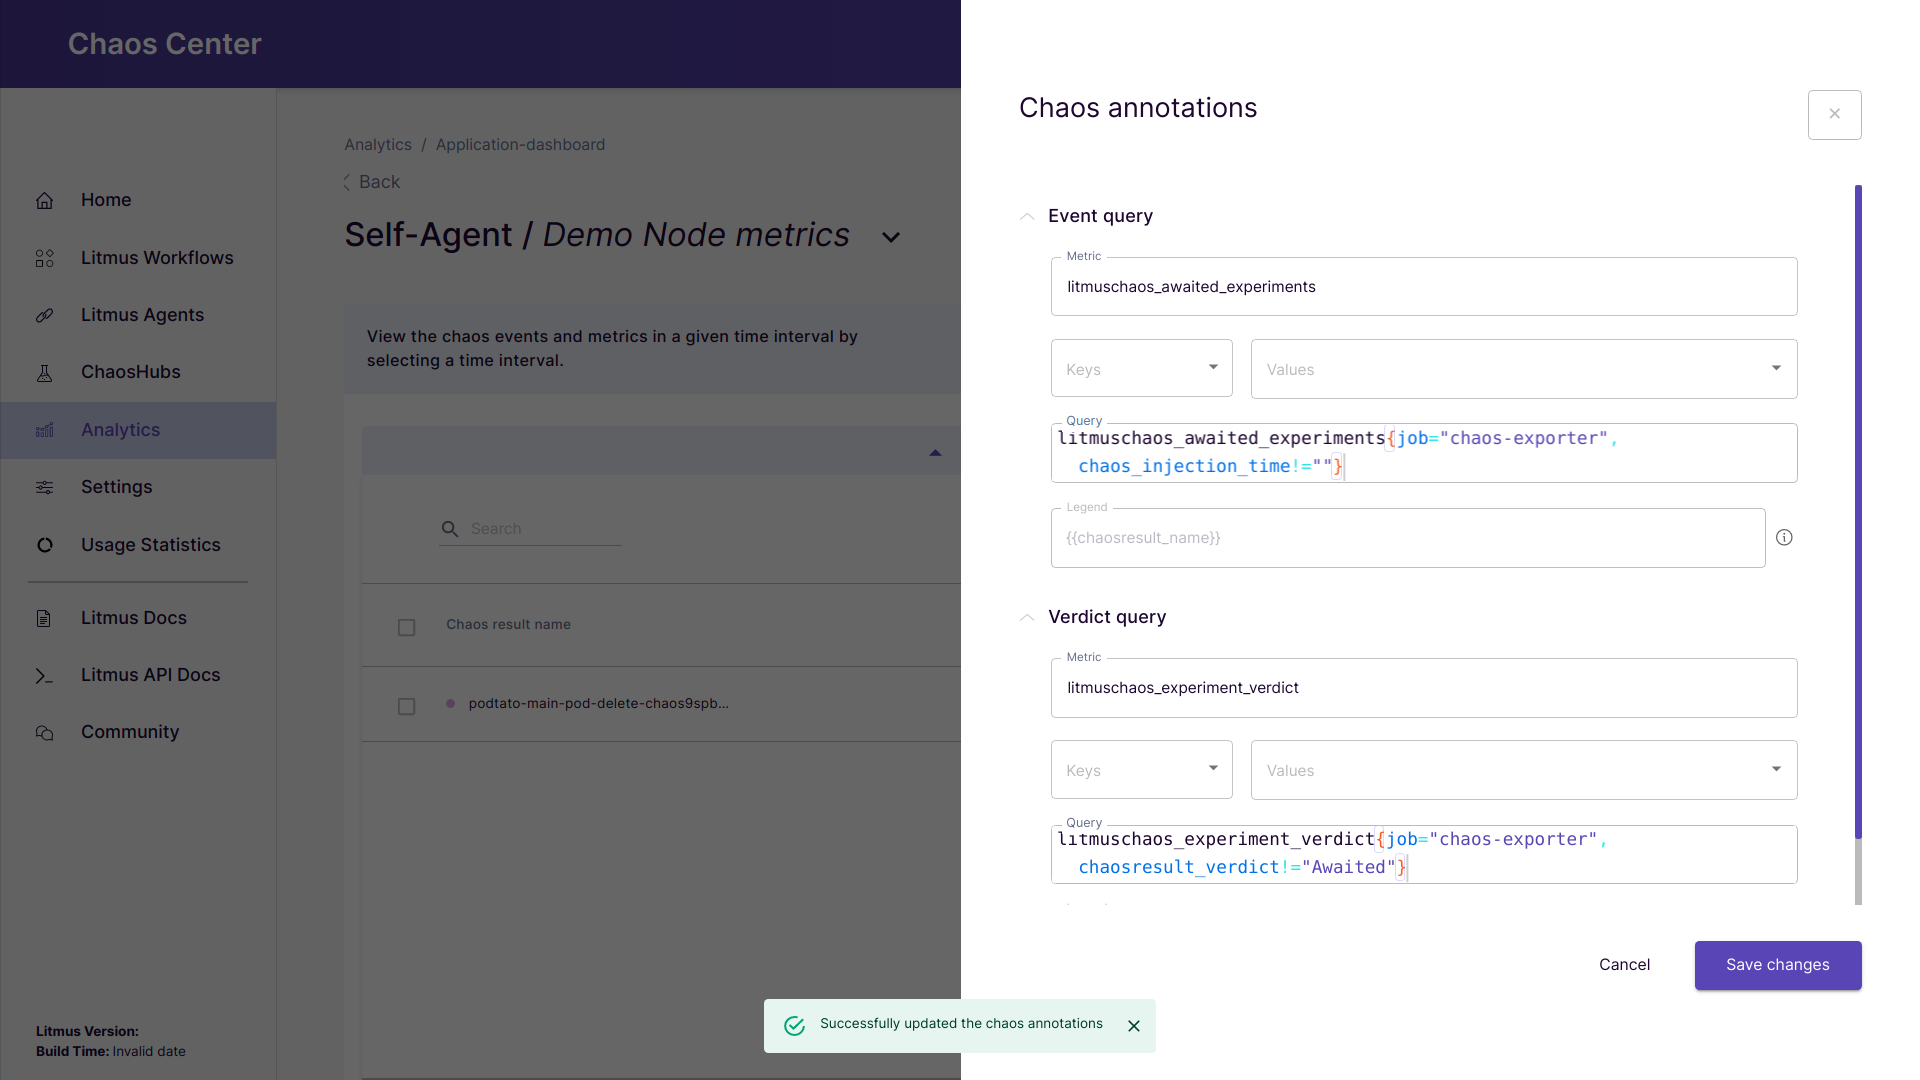 Editing chaos metric queries
- Switch between dashboards for the same chaos delegate : You can switch between the dashboards for the selected chaos delegate . To view a different dashboard for the given chaos delegate , click the dropdown option placed next to the dashboard name which contains the list of all the configured dashboards for that chaos delegate and select a particular dashbord.