Observe chaos impact using Grafana
Chaos Engineering is the discipline of experimenting on a system to build confidence in the system’s capability to withstand turbulent conditions in production. Monitoring a system's resilience and its performance under chaos are one of the fundamental principles of chaos engineering. Litmus has sample chaos interleaved dashboards available on Grafana’s community dashboards as well as provisioned dashboards along with provisioned data sources. Some sample chaos interleaved dashboards can be found here
Before you begin
The following are required before integrating Grafana with litmus 2.0:
Grafana setup with provisioned data source and dashboards using Prometheus deployment with scrape jobs
The following steps can be followed to set up Grafana with Prometheus for accessing the integrated and interleaved dashboards
- Clone the litmus repo
git clone https://github.com/litmuschaos/litmus.git
cd litmus/monitoring
- Create monitoring namespace on the cluster
kubectl create ns monitoring
- Deploy prometheus components
kubectl -n monitoring apply -f utils/prometheus/prometheus-scrape-configuration/
- Deploy metrics exporters
kubectl -n monitoring apply -f utils/metrics-exporters/node-exporter/
kubectl -n monitoring apply -f utils/metrics-exporters/kube-state-metrics/
- Deploy chaos-exporter when the cluster is not connected to litmus 2.0 control plane via litmus chaos delegate (exporter is installed as a part of the chaos delegate bundle)
kubectl -n litmus apply -f utils/metrics-exporters/litmus-metrics/chaos-exporter/
- Deploy Grafana
kubectl -n monitoring apply -f utils/grafana/
You may access the grafana dashboard via the LoadBalancer (or NodePort) service IP or via a port-forward operation on localhost and then view it from manage dashboards section.
View the services running in the monitoring namespace
kubectl get svc -n monitoring
Now copy the EXTERNAL-IP of grafana and view it in the browser
Default username/password credentials: admin/admin
Screenshots
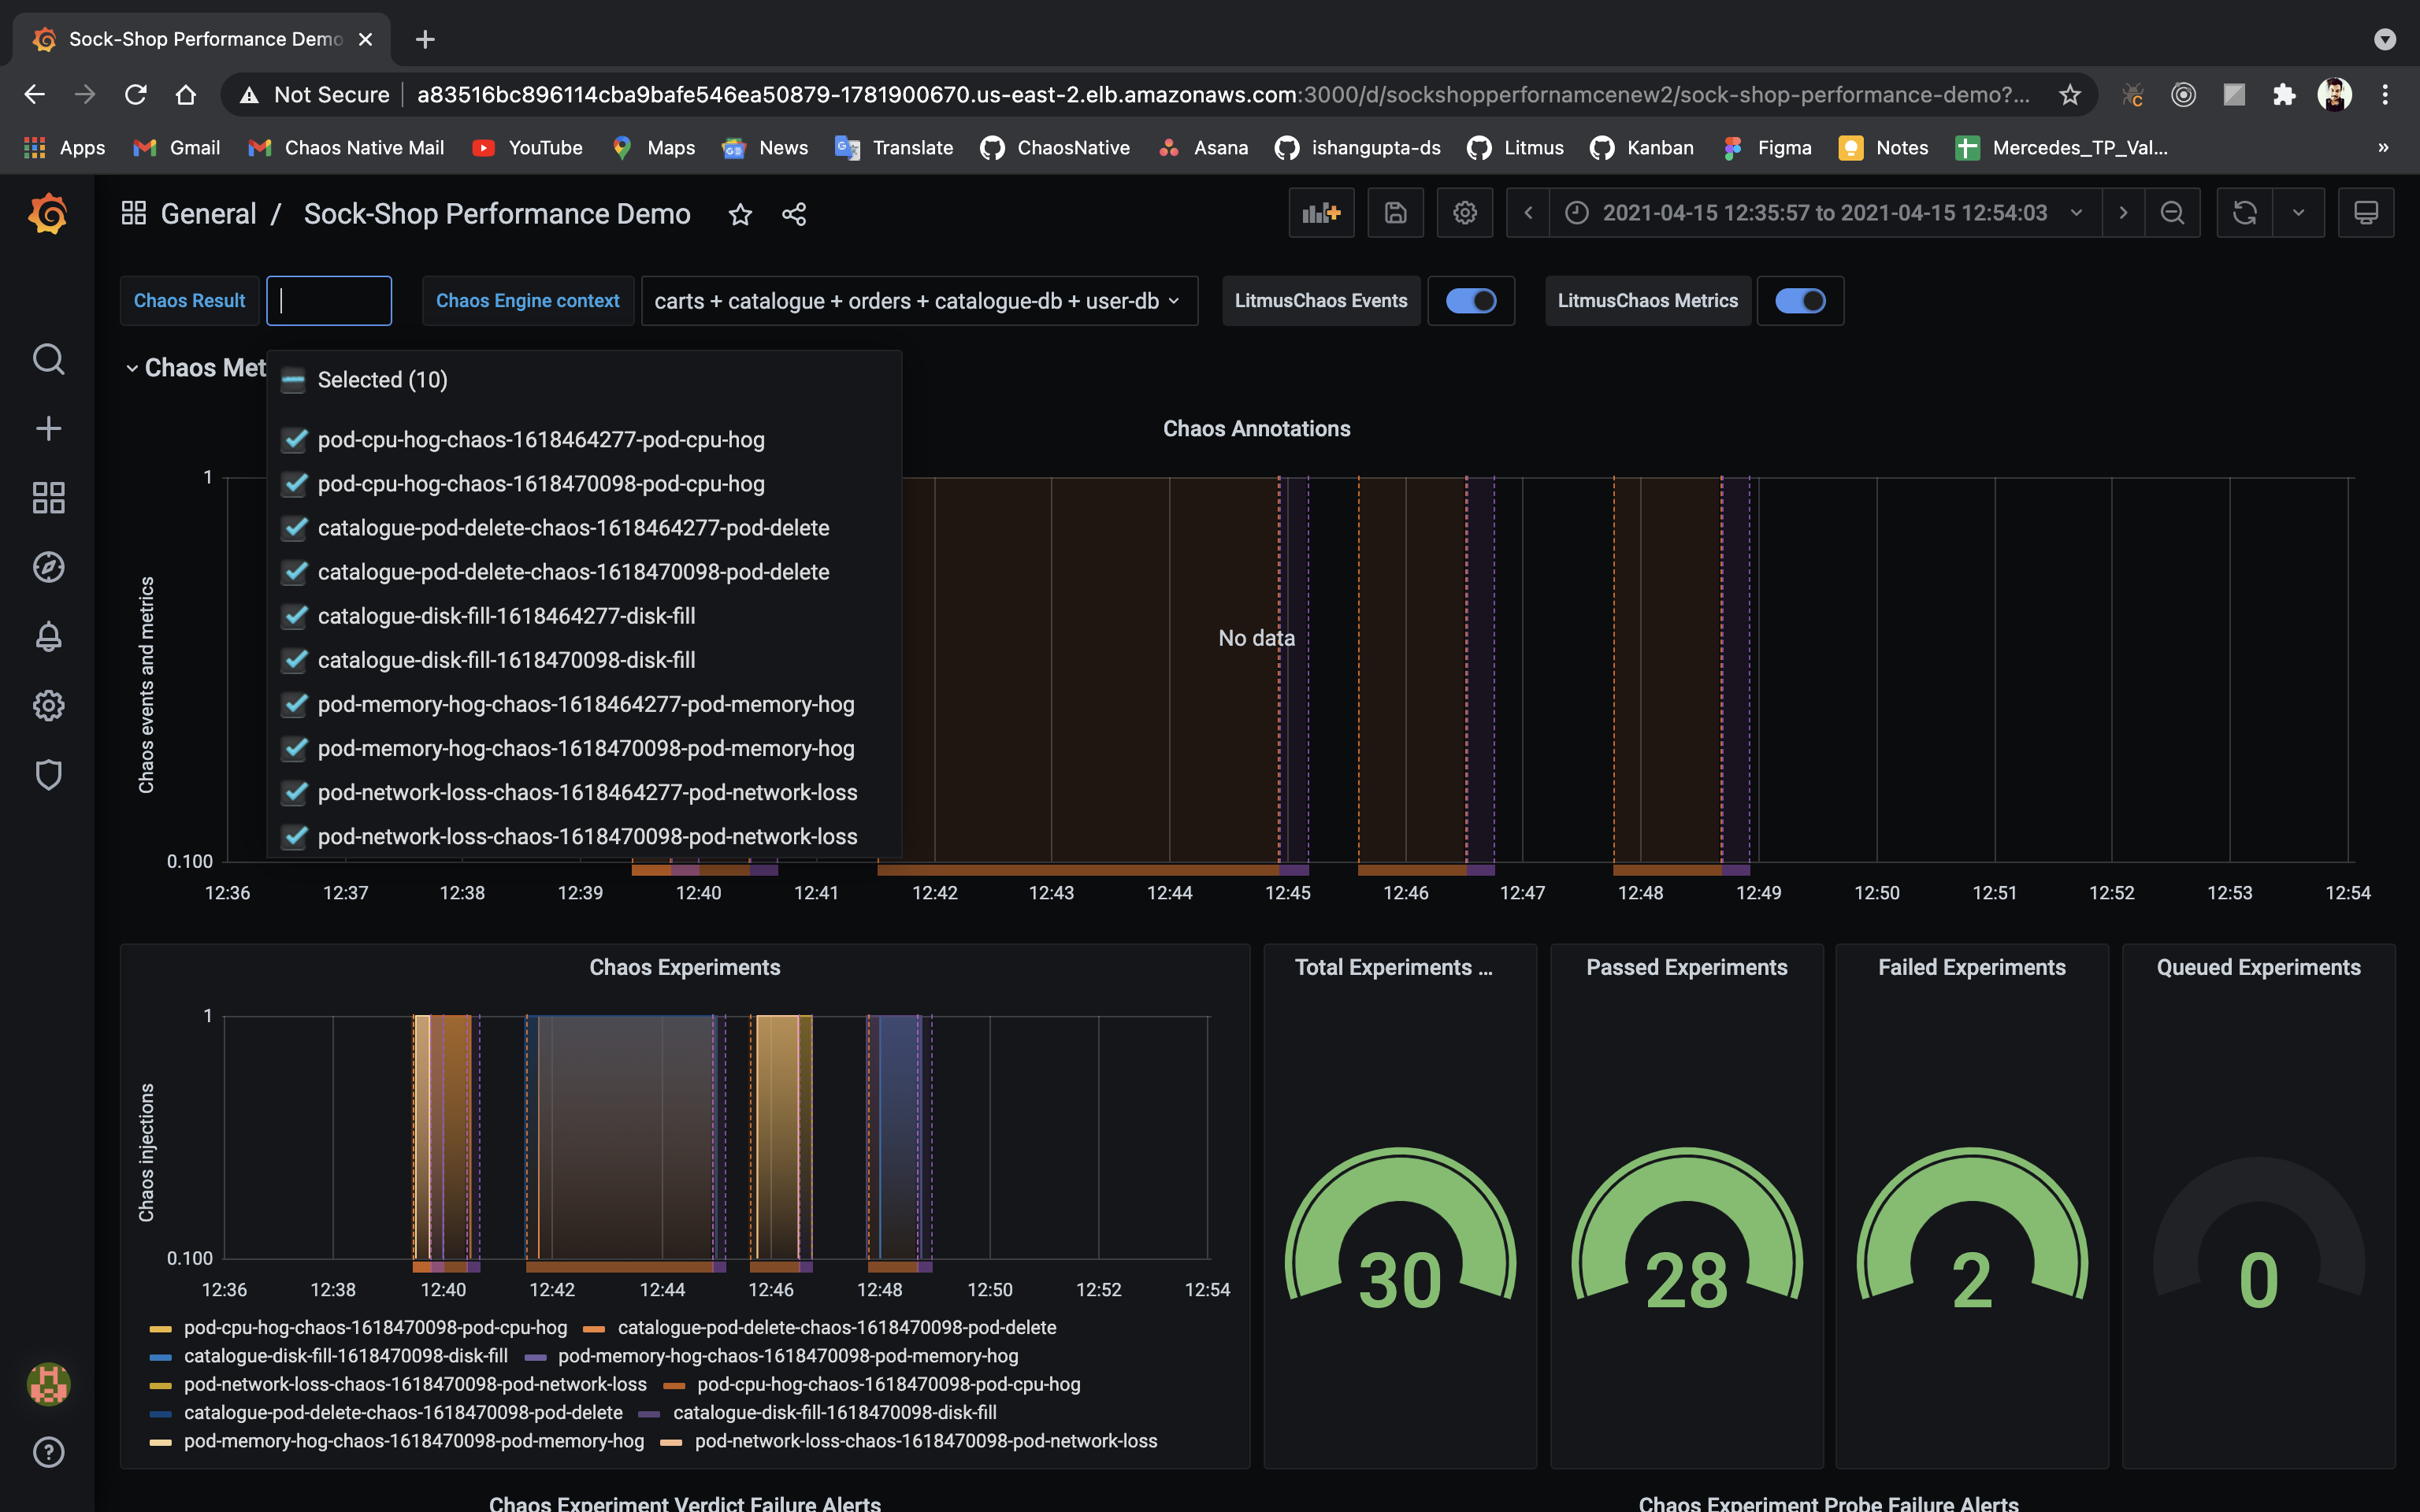
Chaos Result selector dropdown:
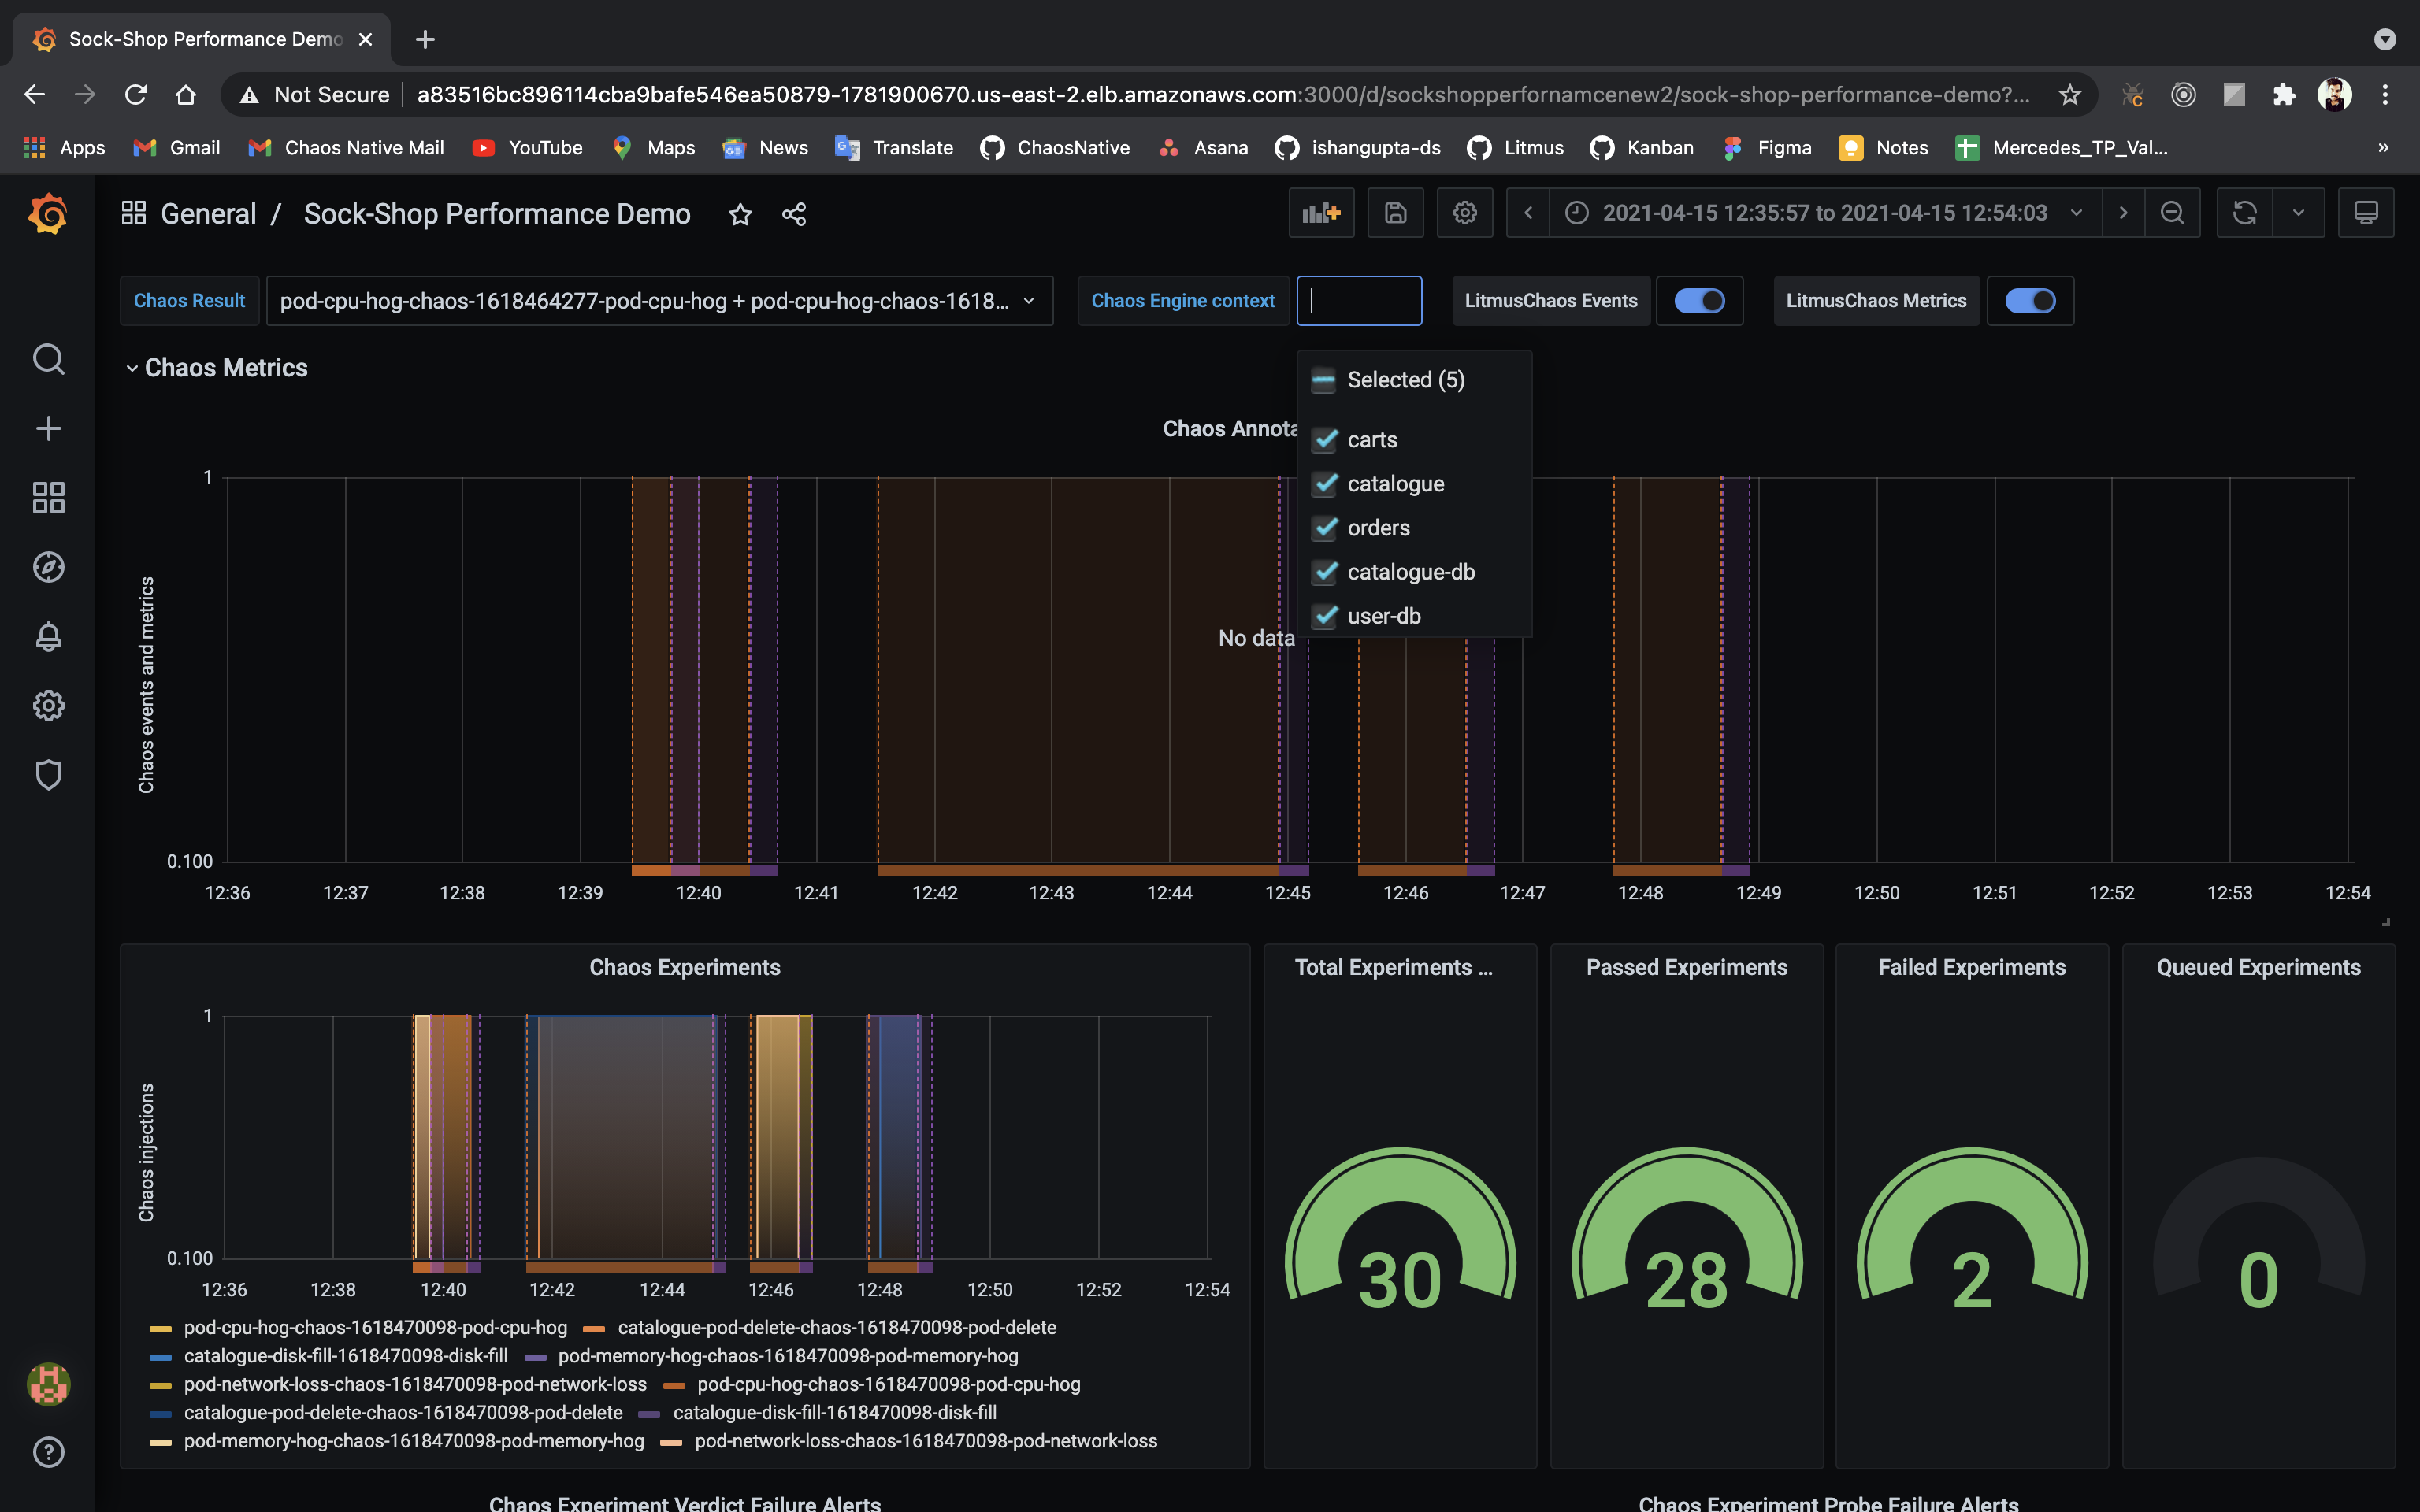
Chaos Engine Context (Target application's NAMESPACE_LABEL) selector dropdown:
Chaos Engines with Experiments as Chaos Results:

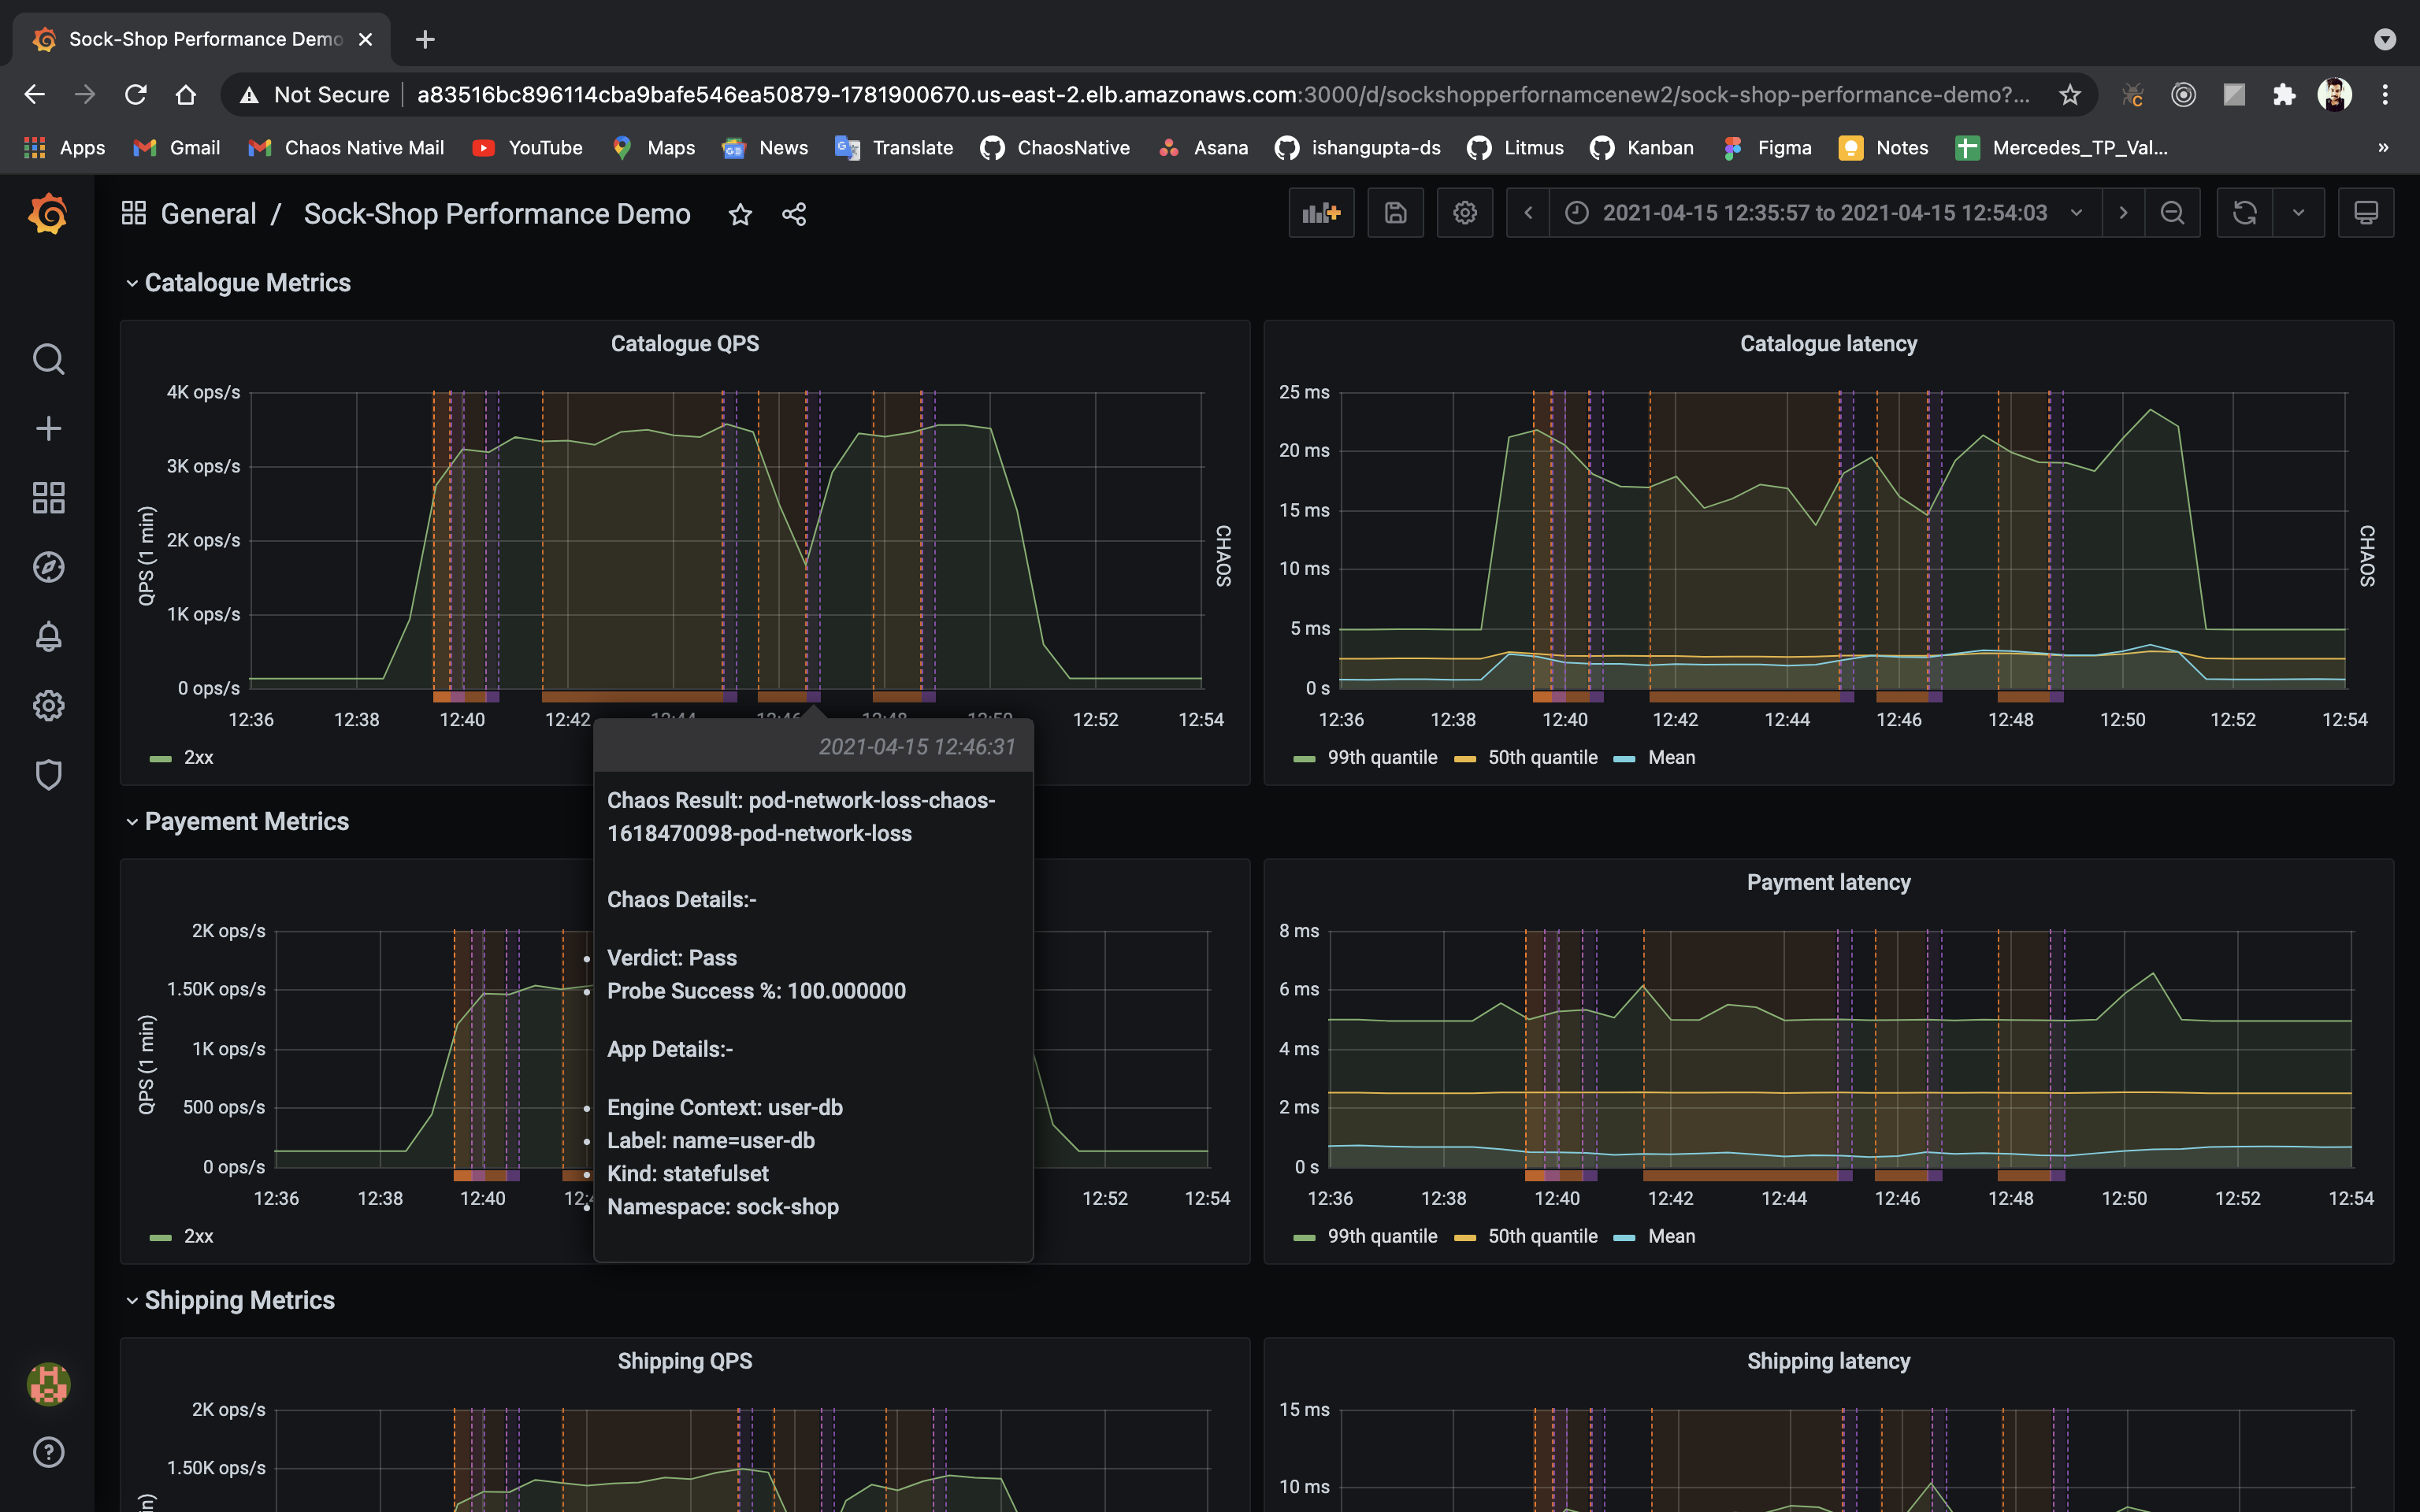
Chaos event annotations:
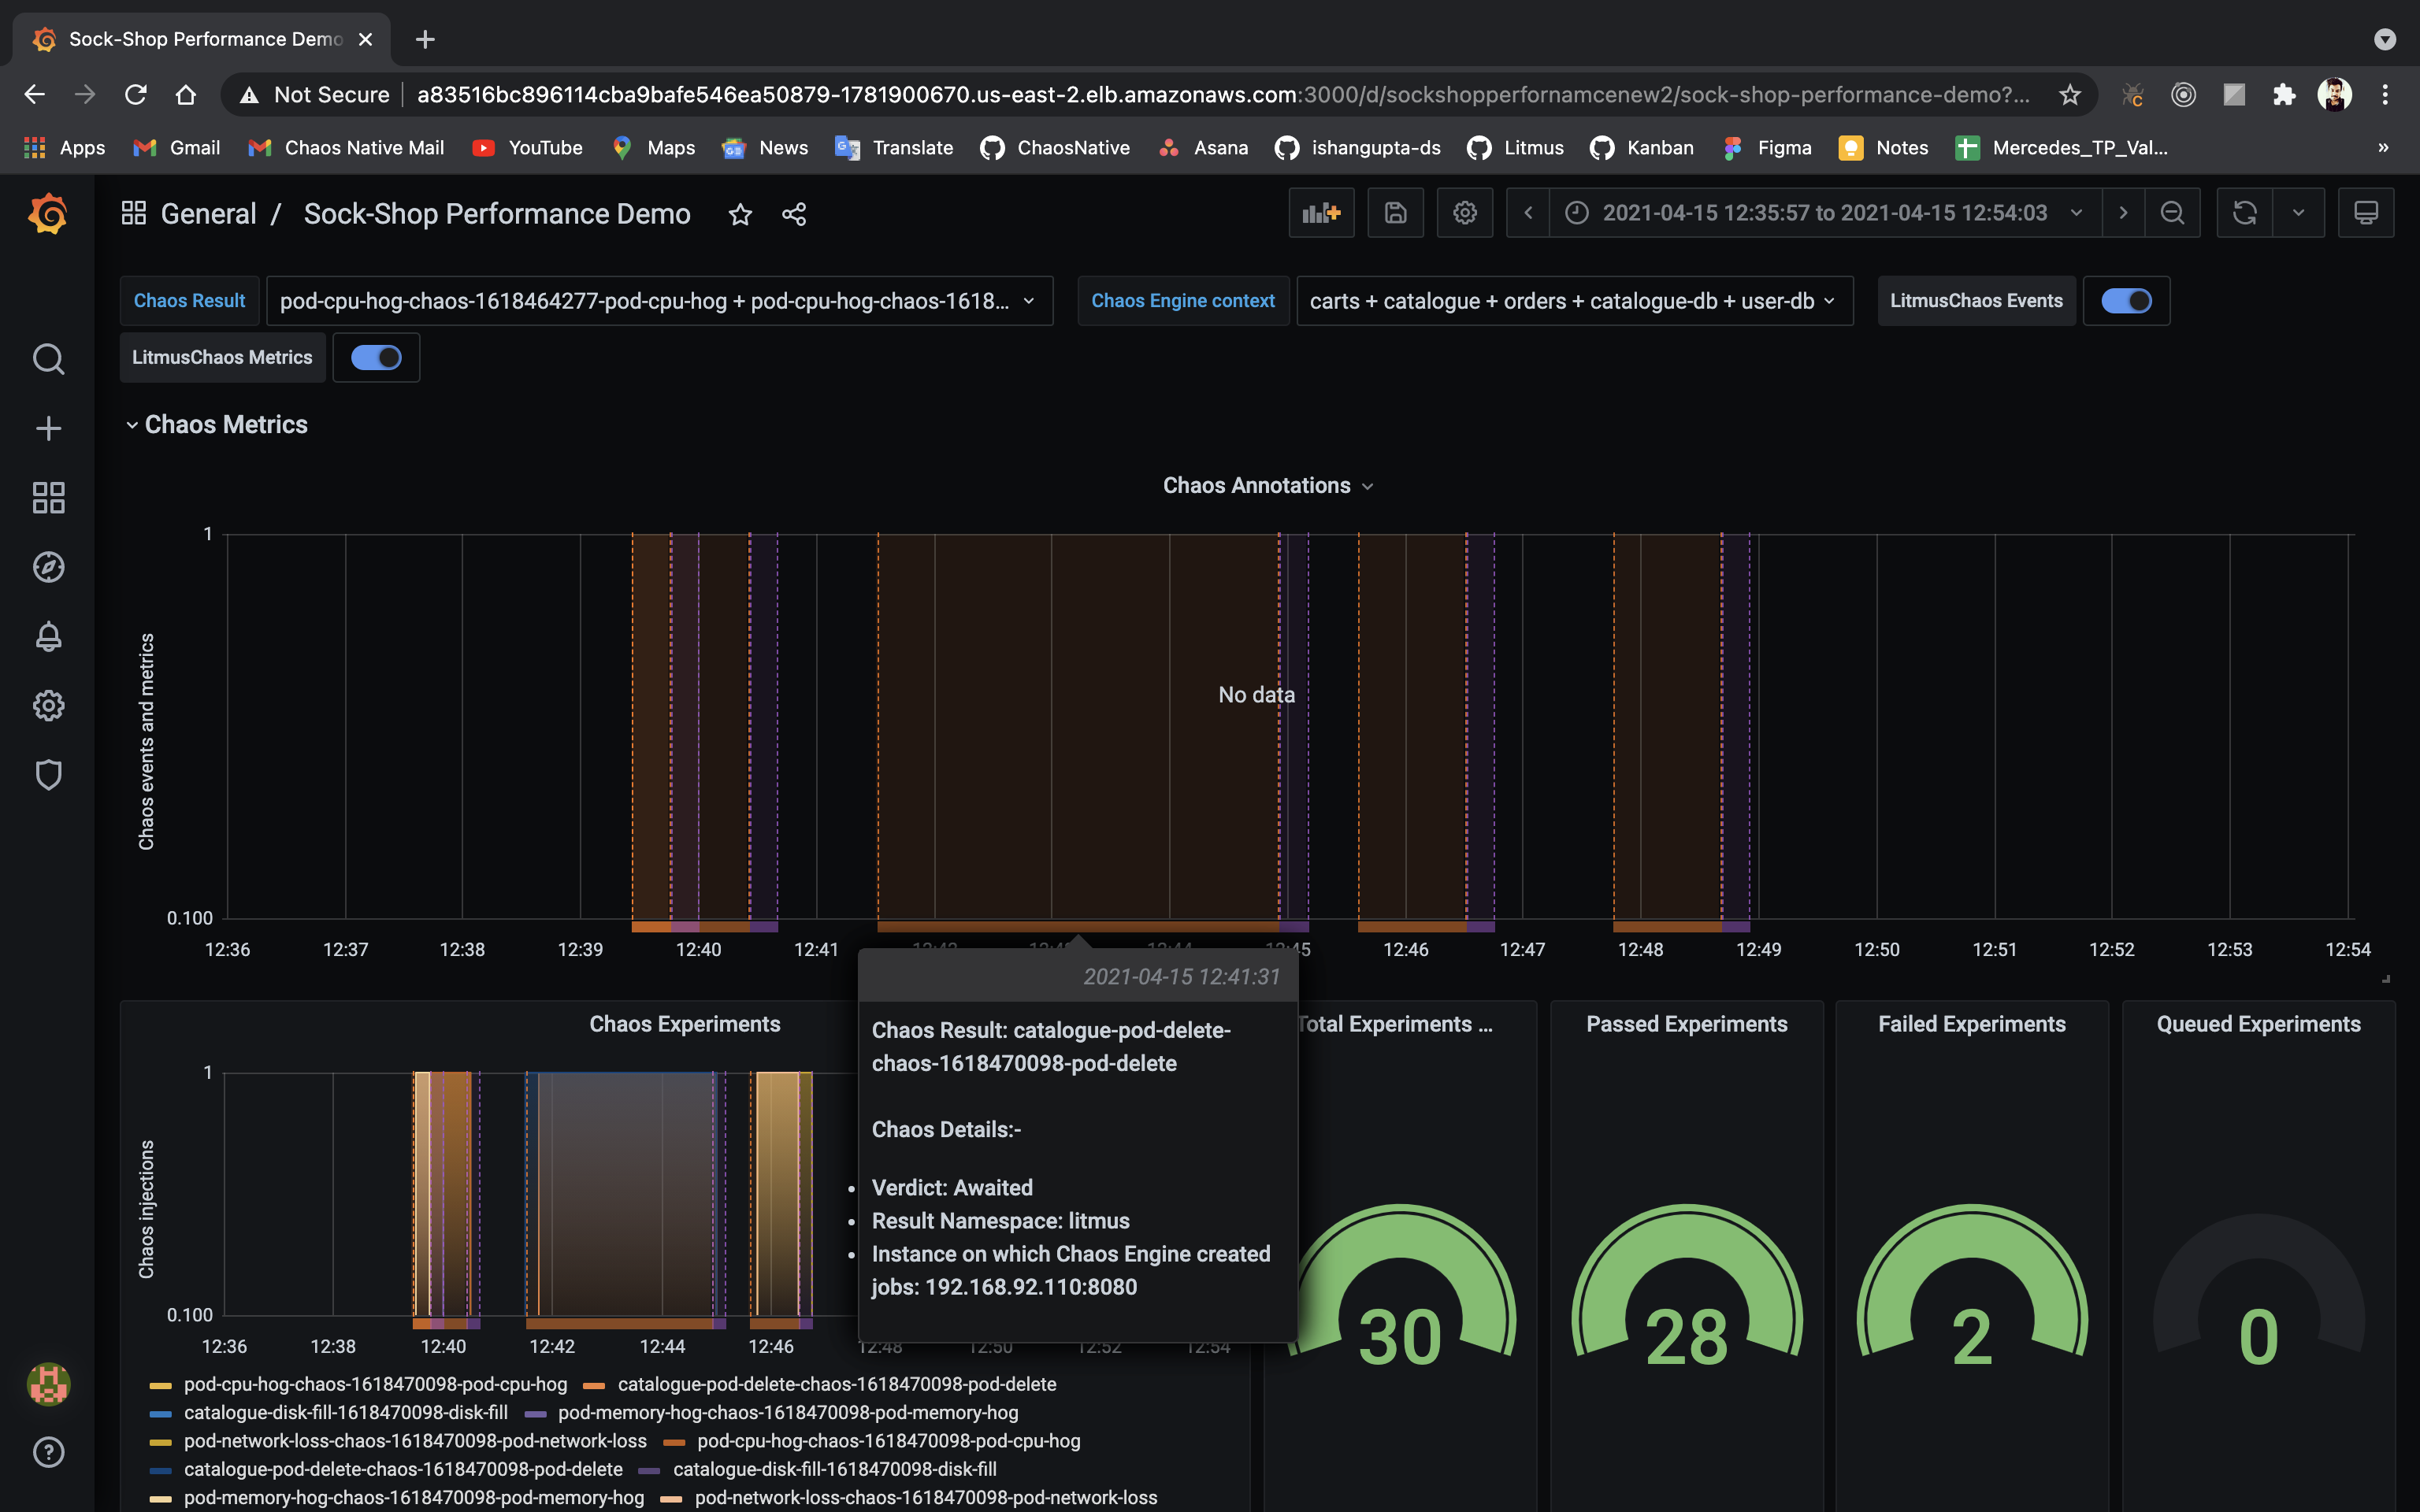
Chaos Result verdict annotations:

Interleaved Chaos events:
Interleaved Chaos Result verdicts:
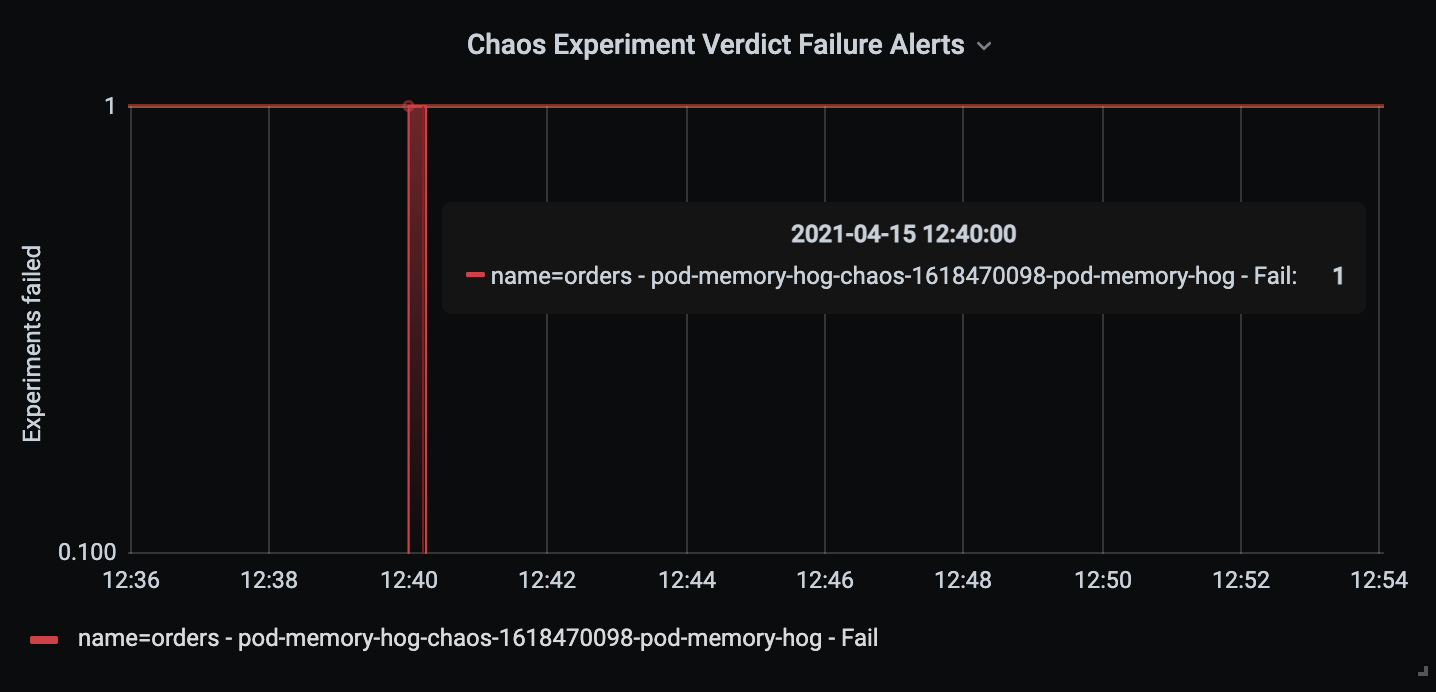
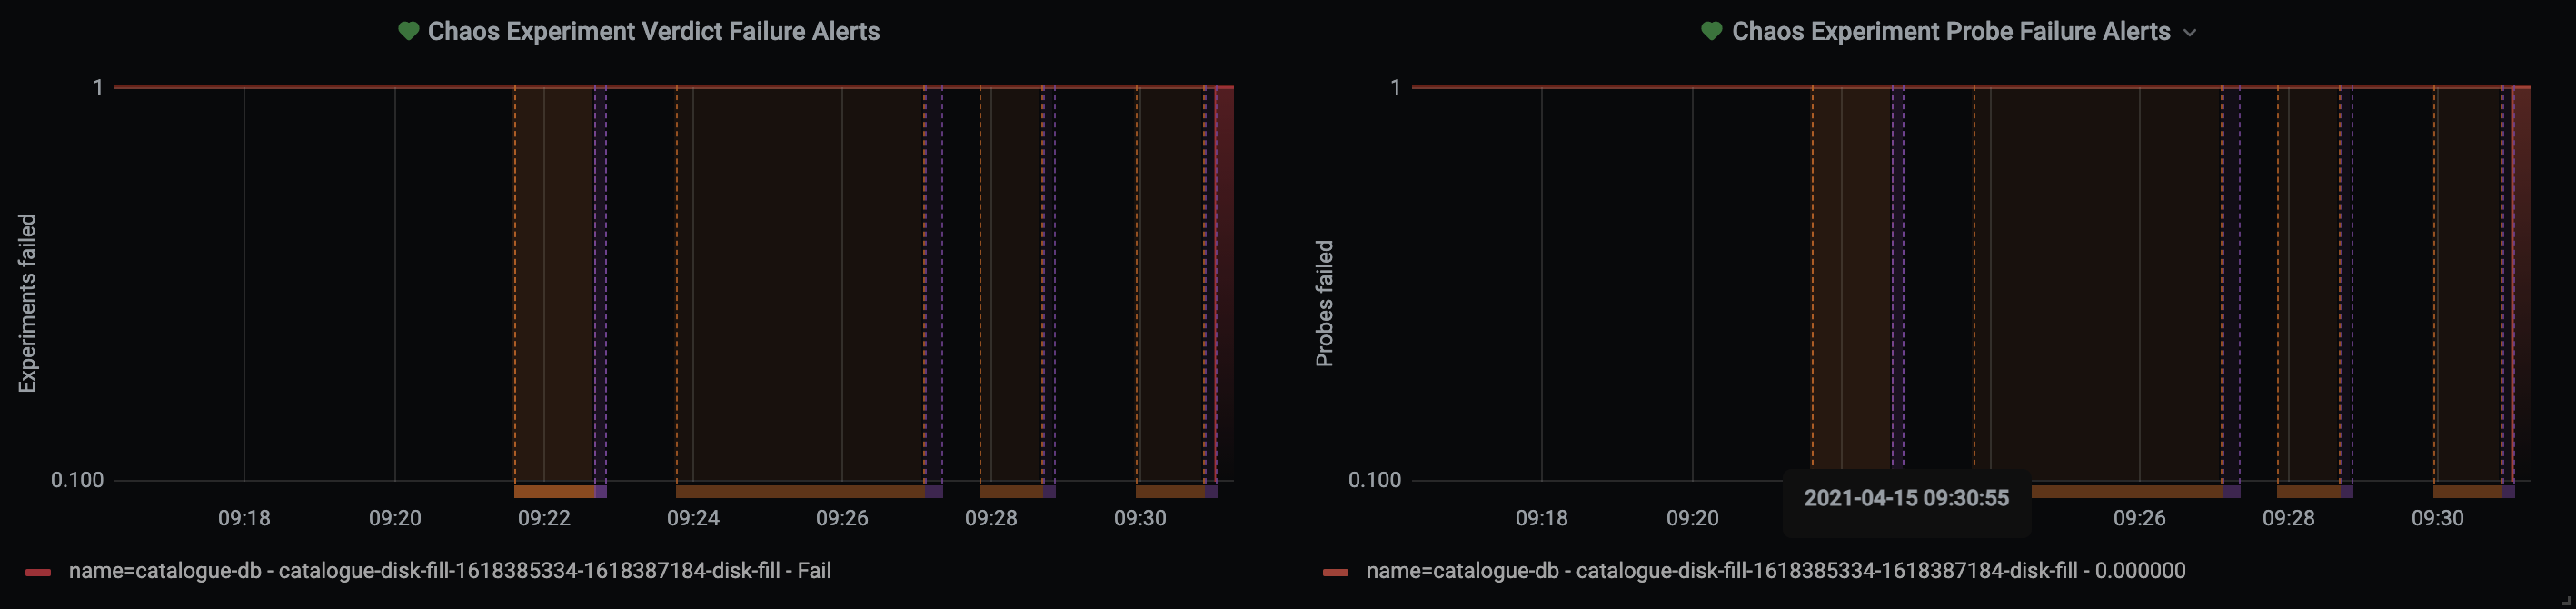
Chaos Result verdict failure alerts:
Chaos Result probe failure alerts:

Systems healthy / in steady state OR no alerts to be issued:
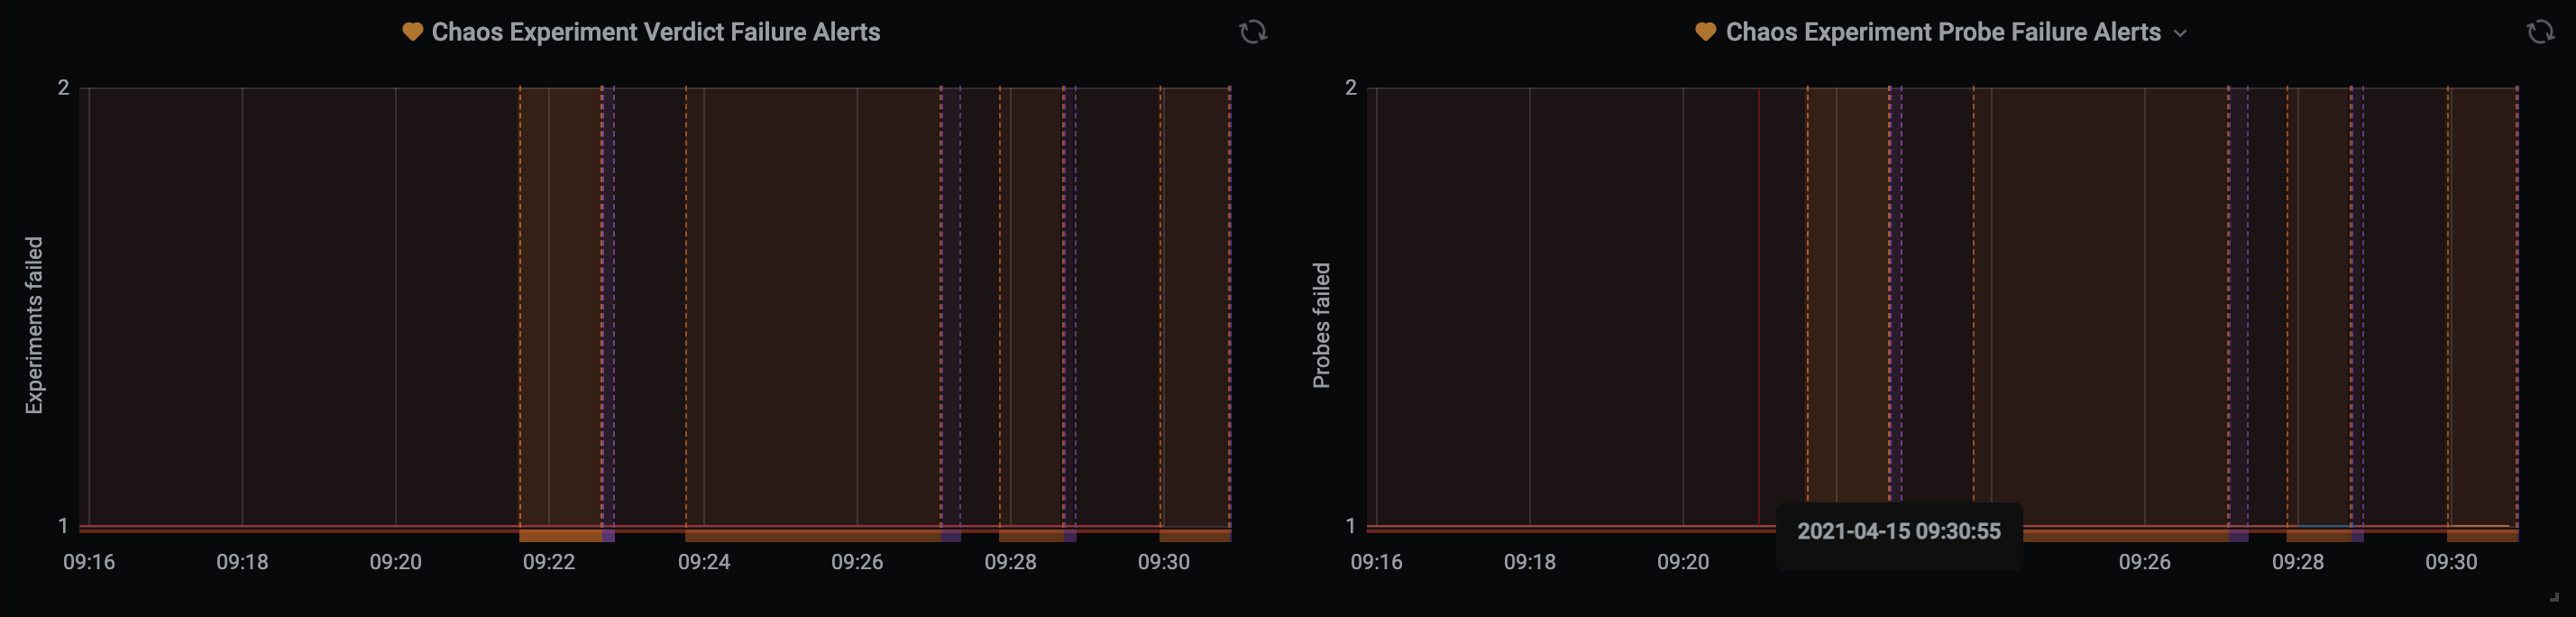
Systems un-healthy / failed to regain steady state after chaos / meet SLO OR alerts are issued:

Alerts issued:
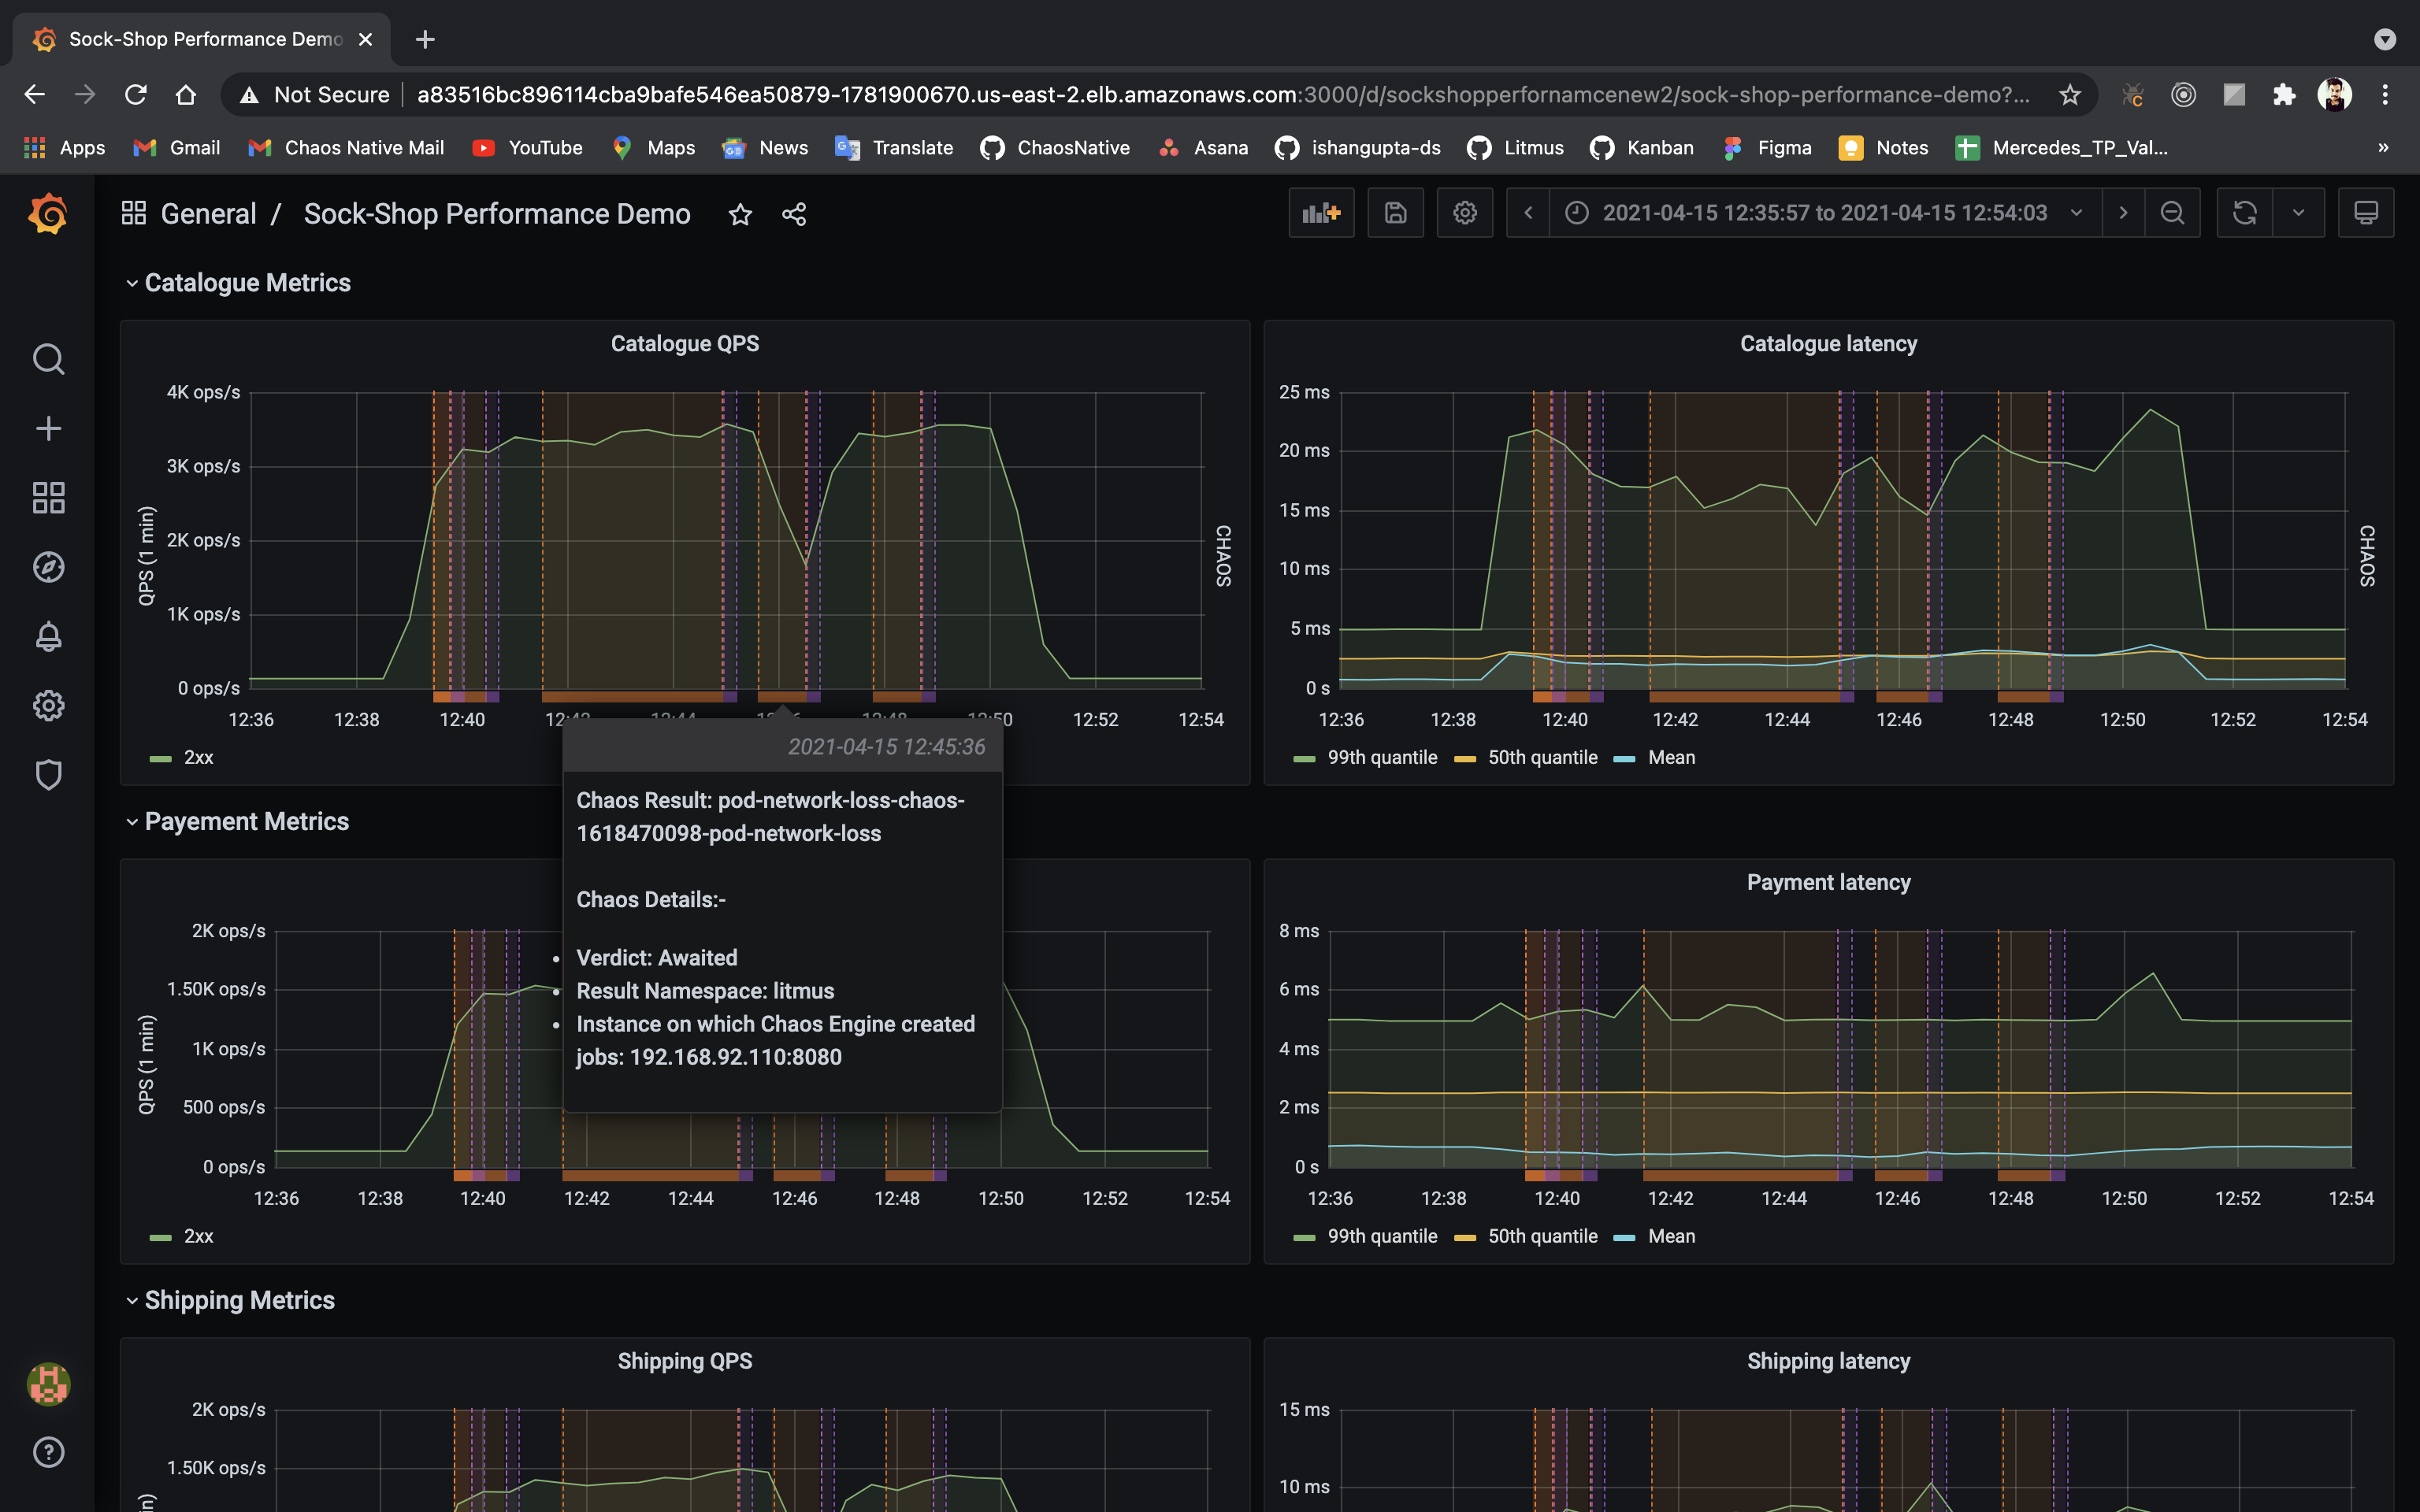
Chaos interleaving over infra and application metrics
Chaos interleaving can be achieved using the litmuschaos_awaited_experiments and litmuschaos_experiment_verdict prometheus metrics which can be transformed using grafana variables and annotations into chaos injection events with metadata and results to monitor the application under test or infrastructure under test.
Sample variable configurations:
Queries:
chaosresult_name
label_values(litmuschaos_awaited_experiments{app=~"chaos-exporter"}, chaosresult_name)
chaosengine_context
label_values(litmuschaos_experiment_verdict{app=~"chaos-exporter"}, chaosengine_context)
Screenshots
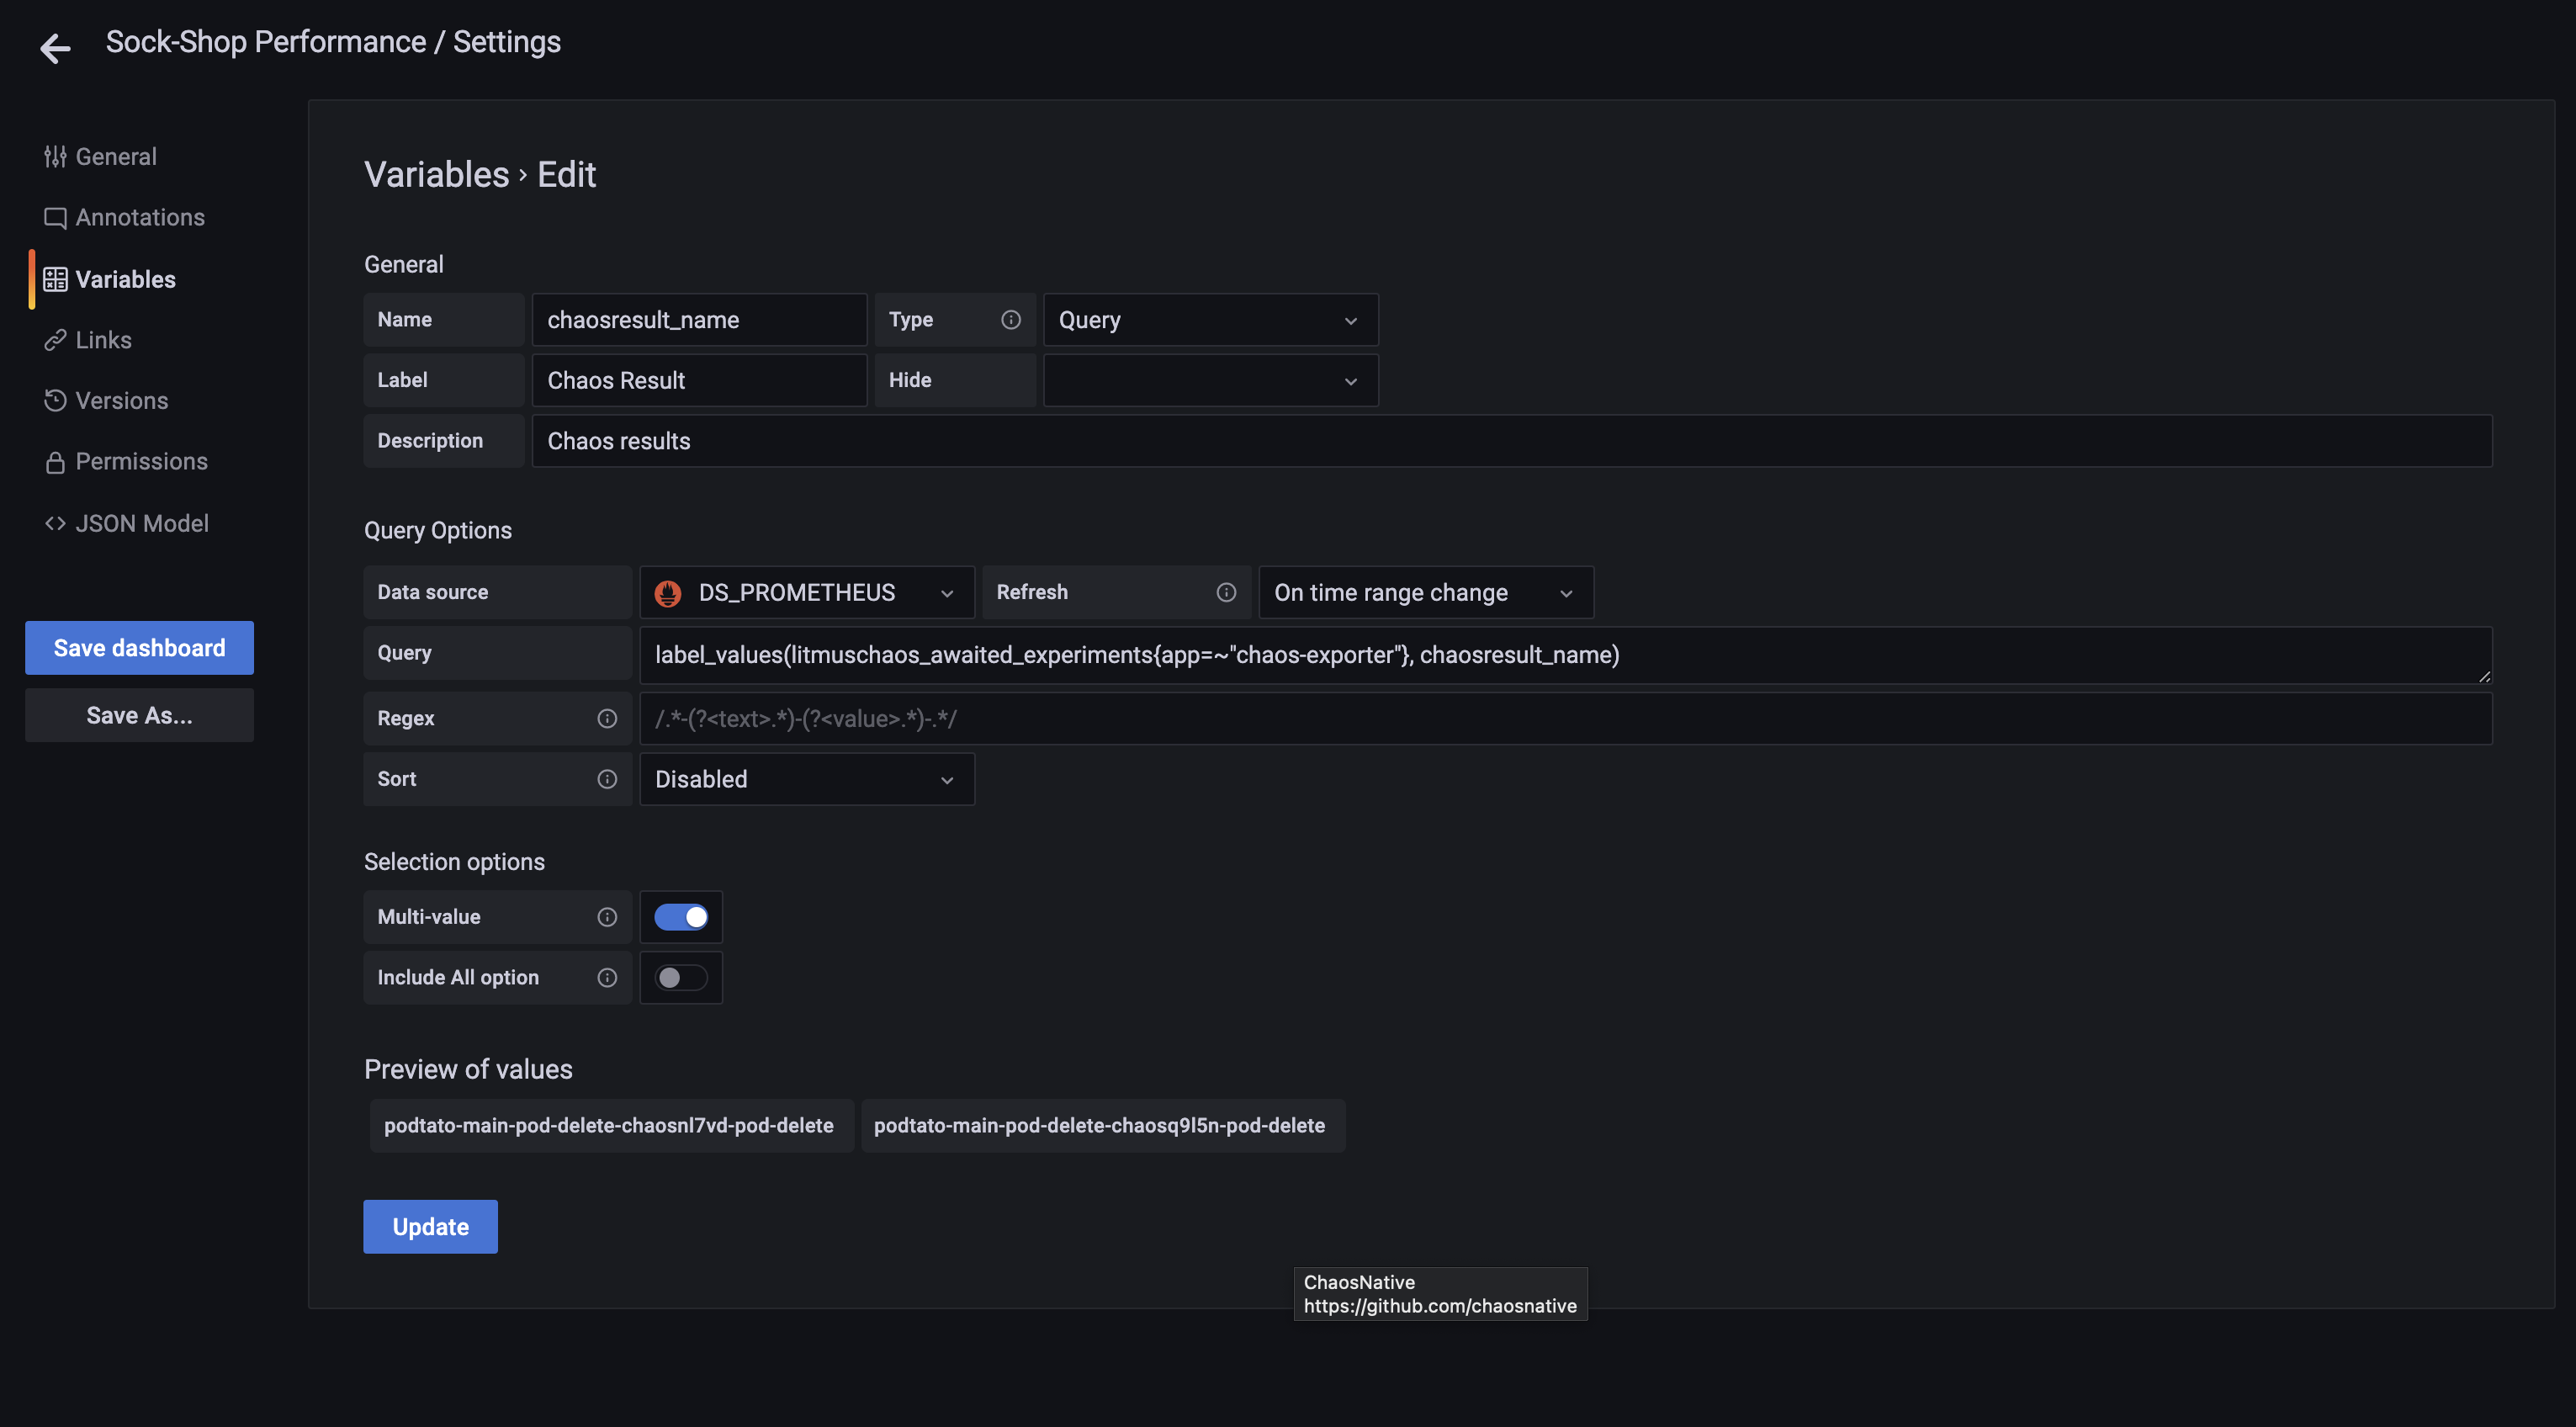 Chaos result name variable
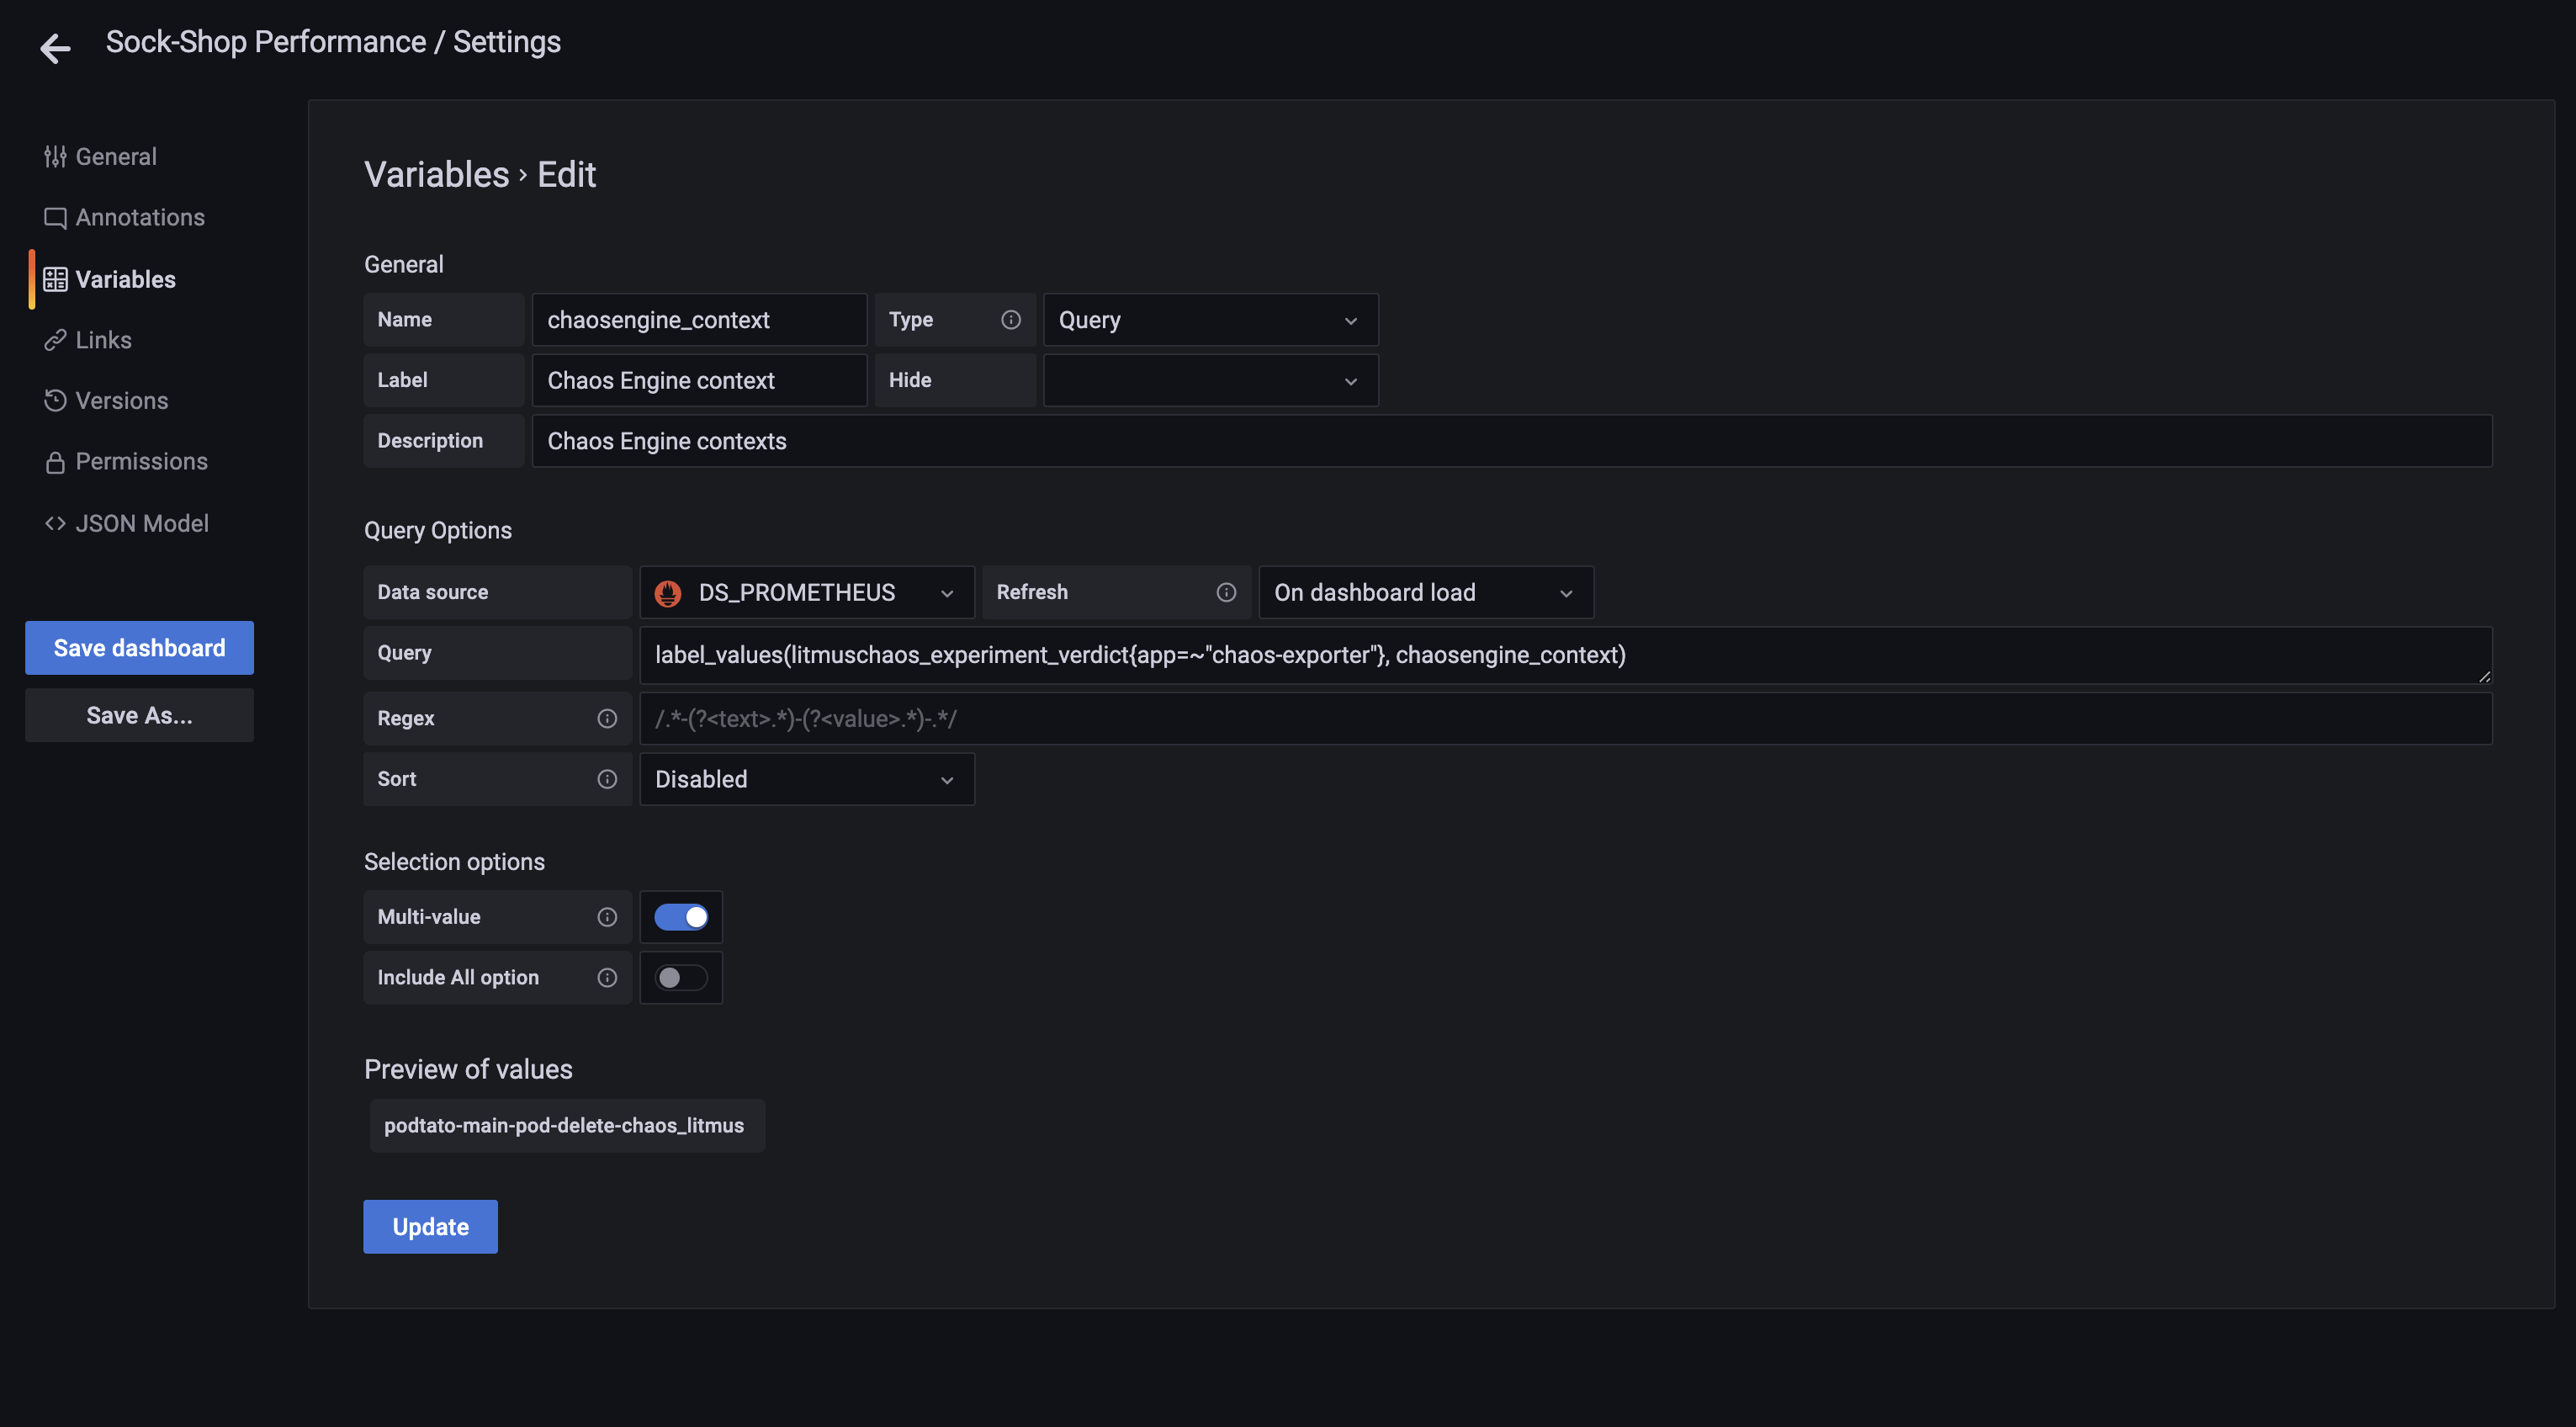 Chaos engine context variable
Sample annotation configurations:
Queries:
LitmusChaos Events
litmuschaos_awaited_experiments{chaosresult_name=~"$chaosresult_name", job="litmus/chaos-exporter", app="chaos-exporter"}
LitmusChaos Metrics
litmuschaos_experiment_verdict{chaosresult_name=~"$chaosresult_name",chaosengine_context=~"$chaosengine_context", job="litmus/chaos-exporter", app="chaos-exporter"}
Screenshots
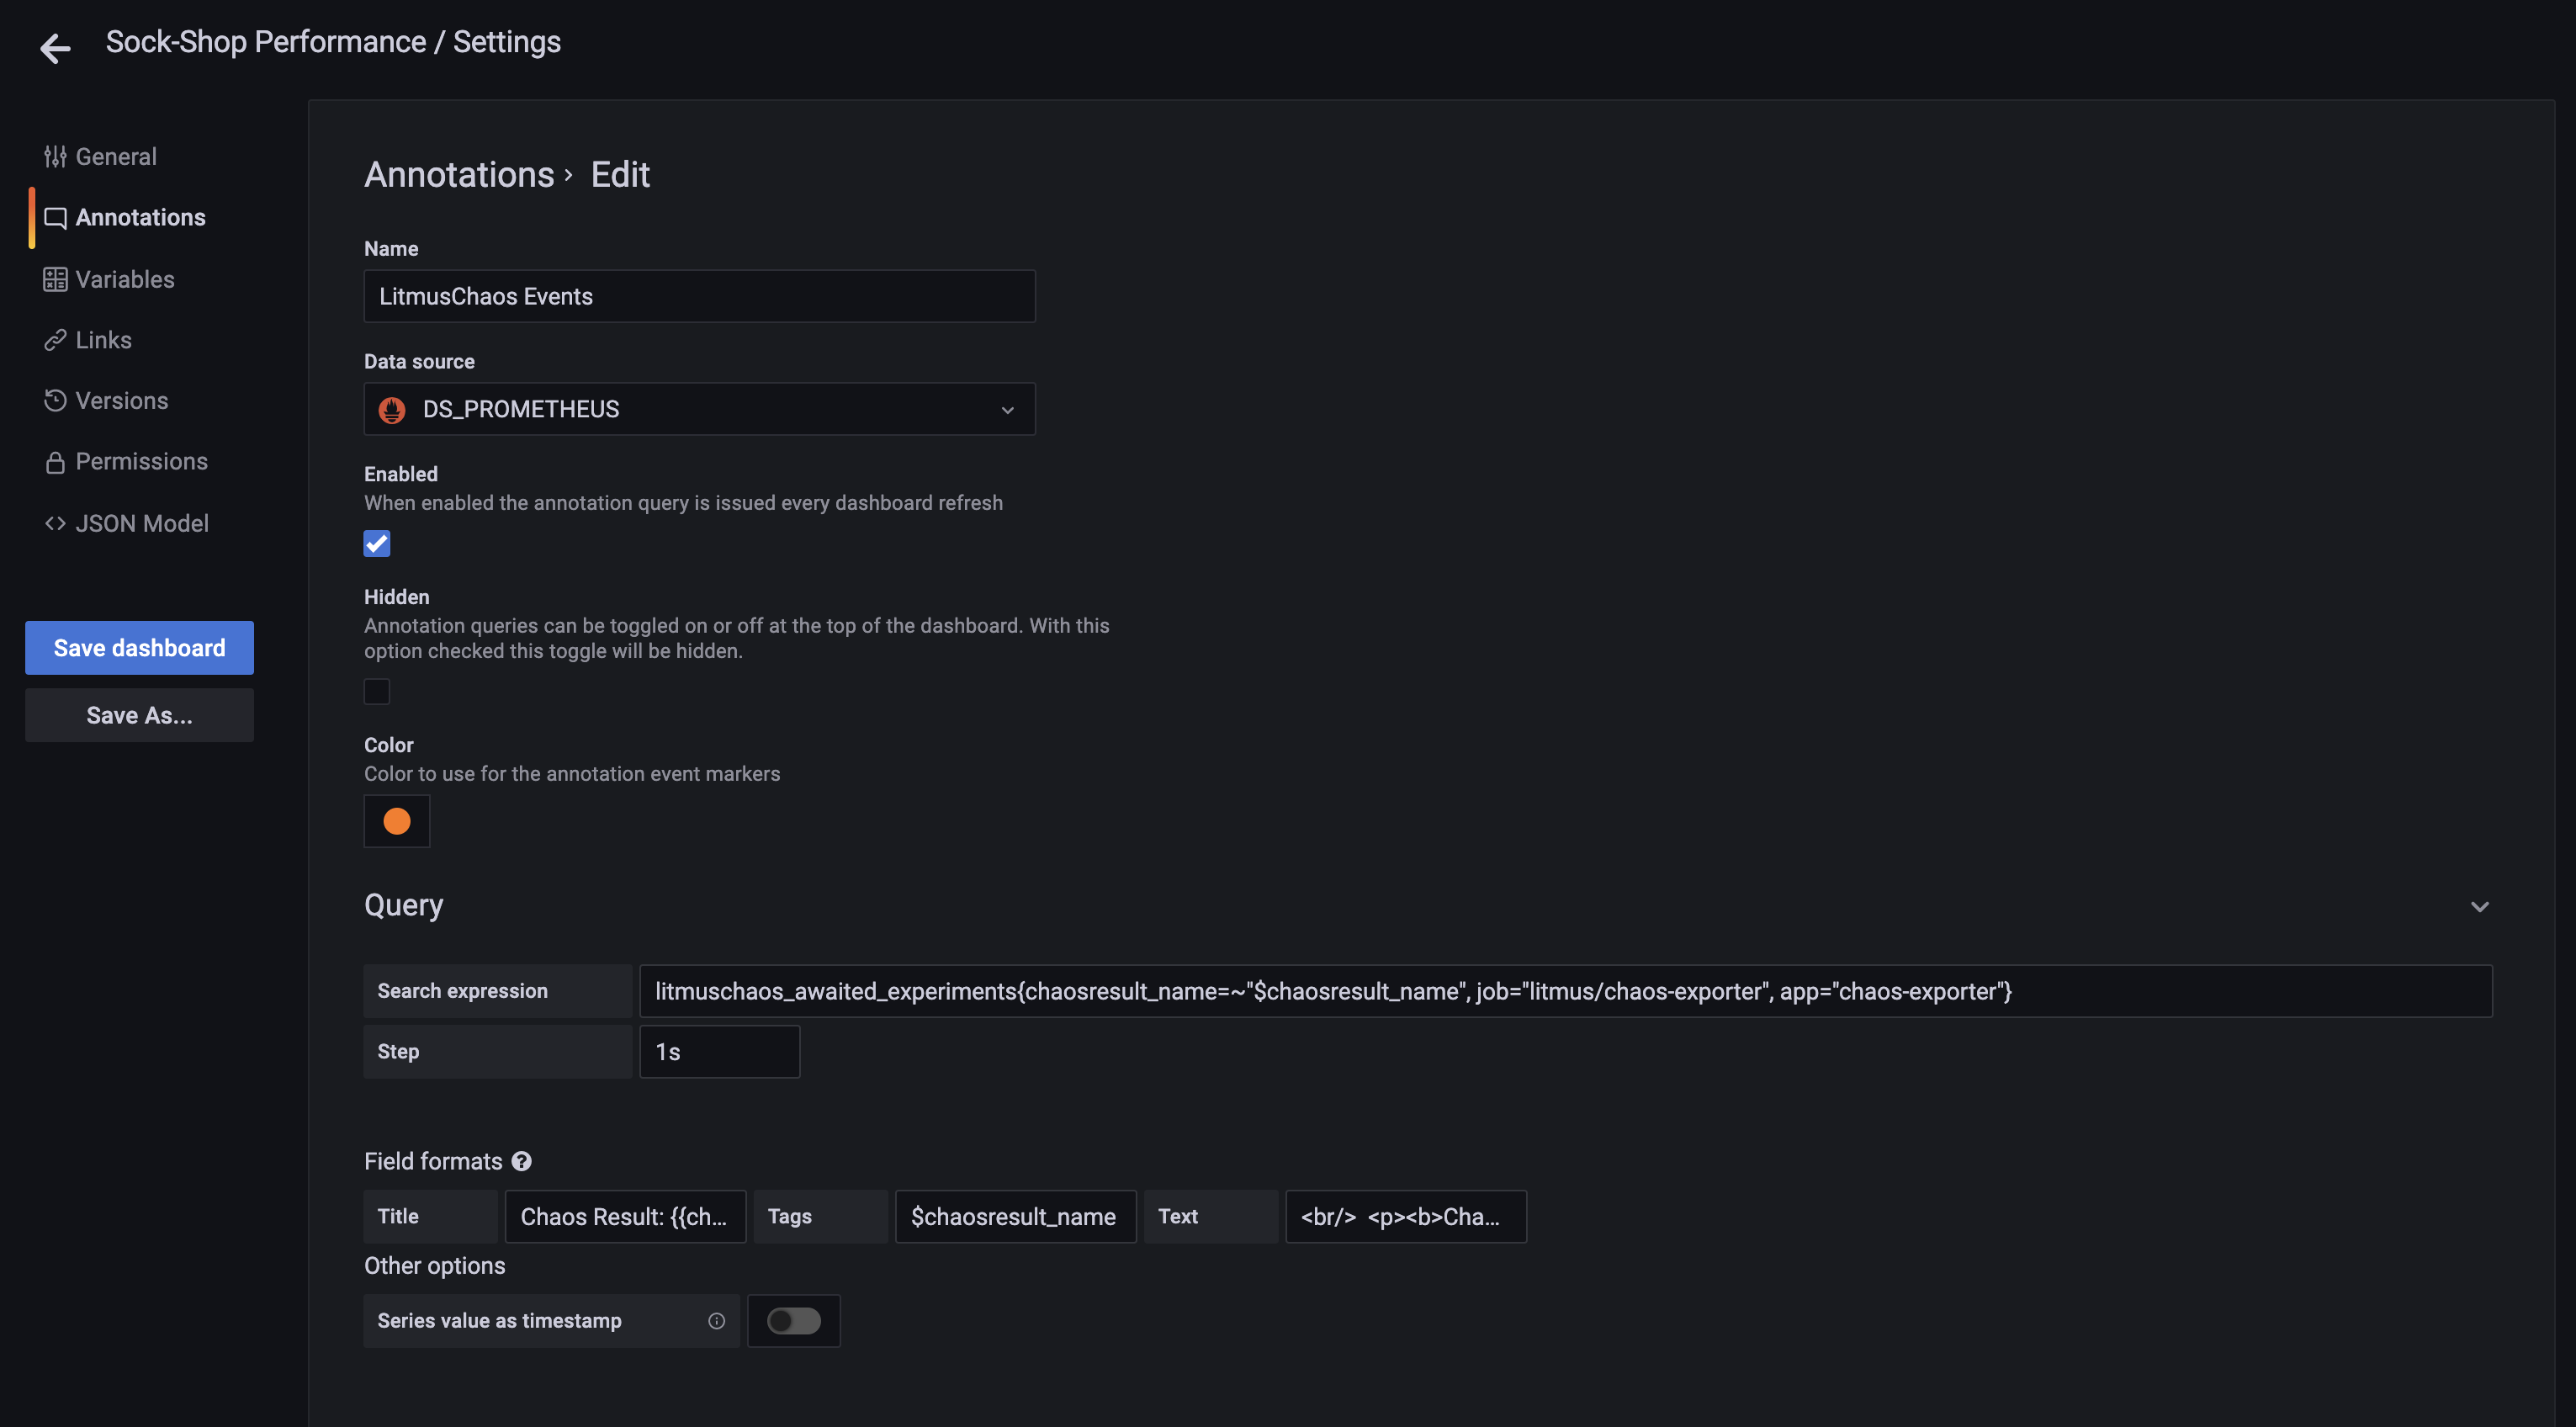 Chaos event annotation
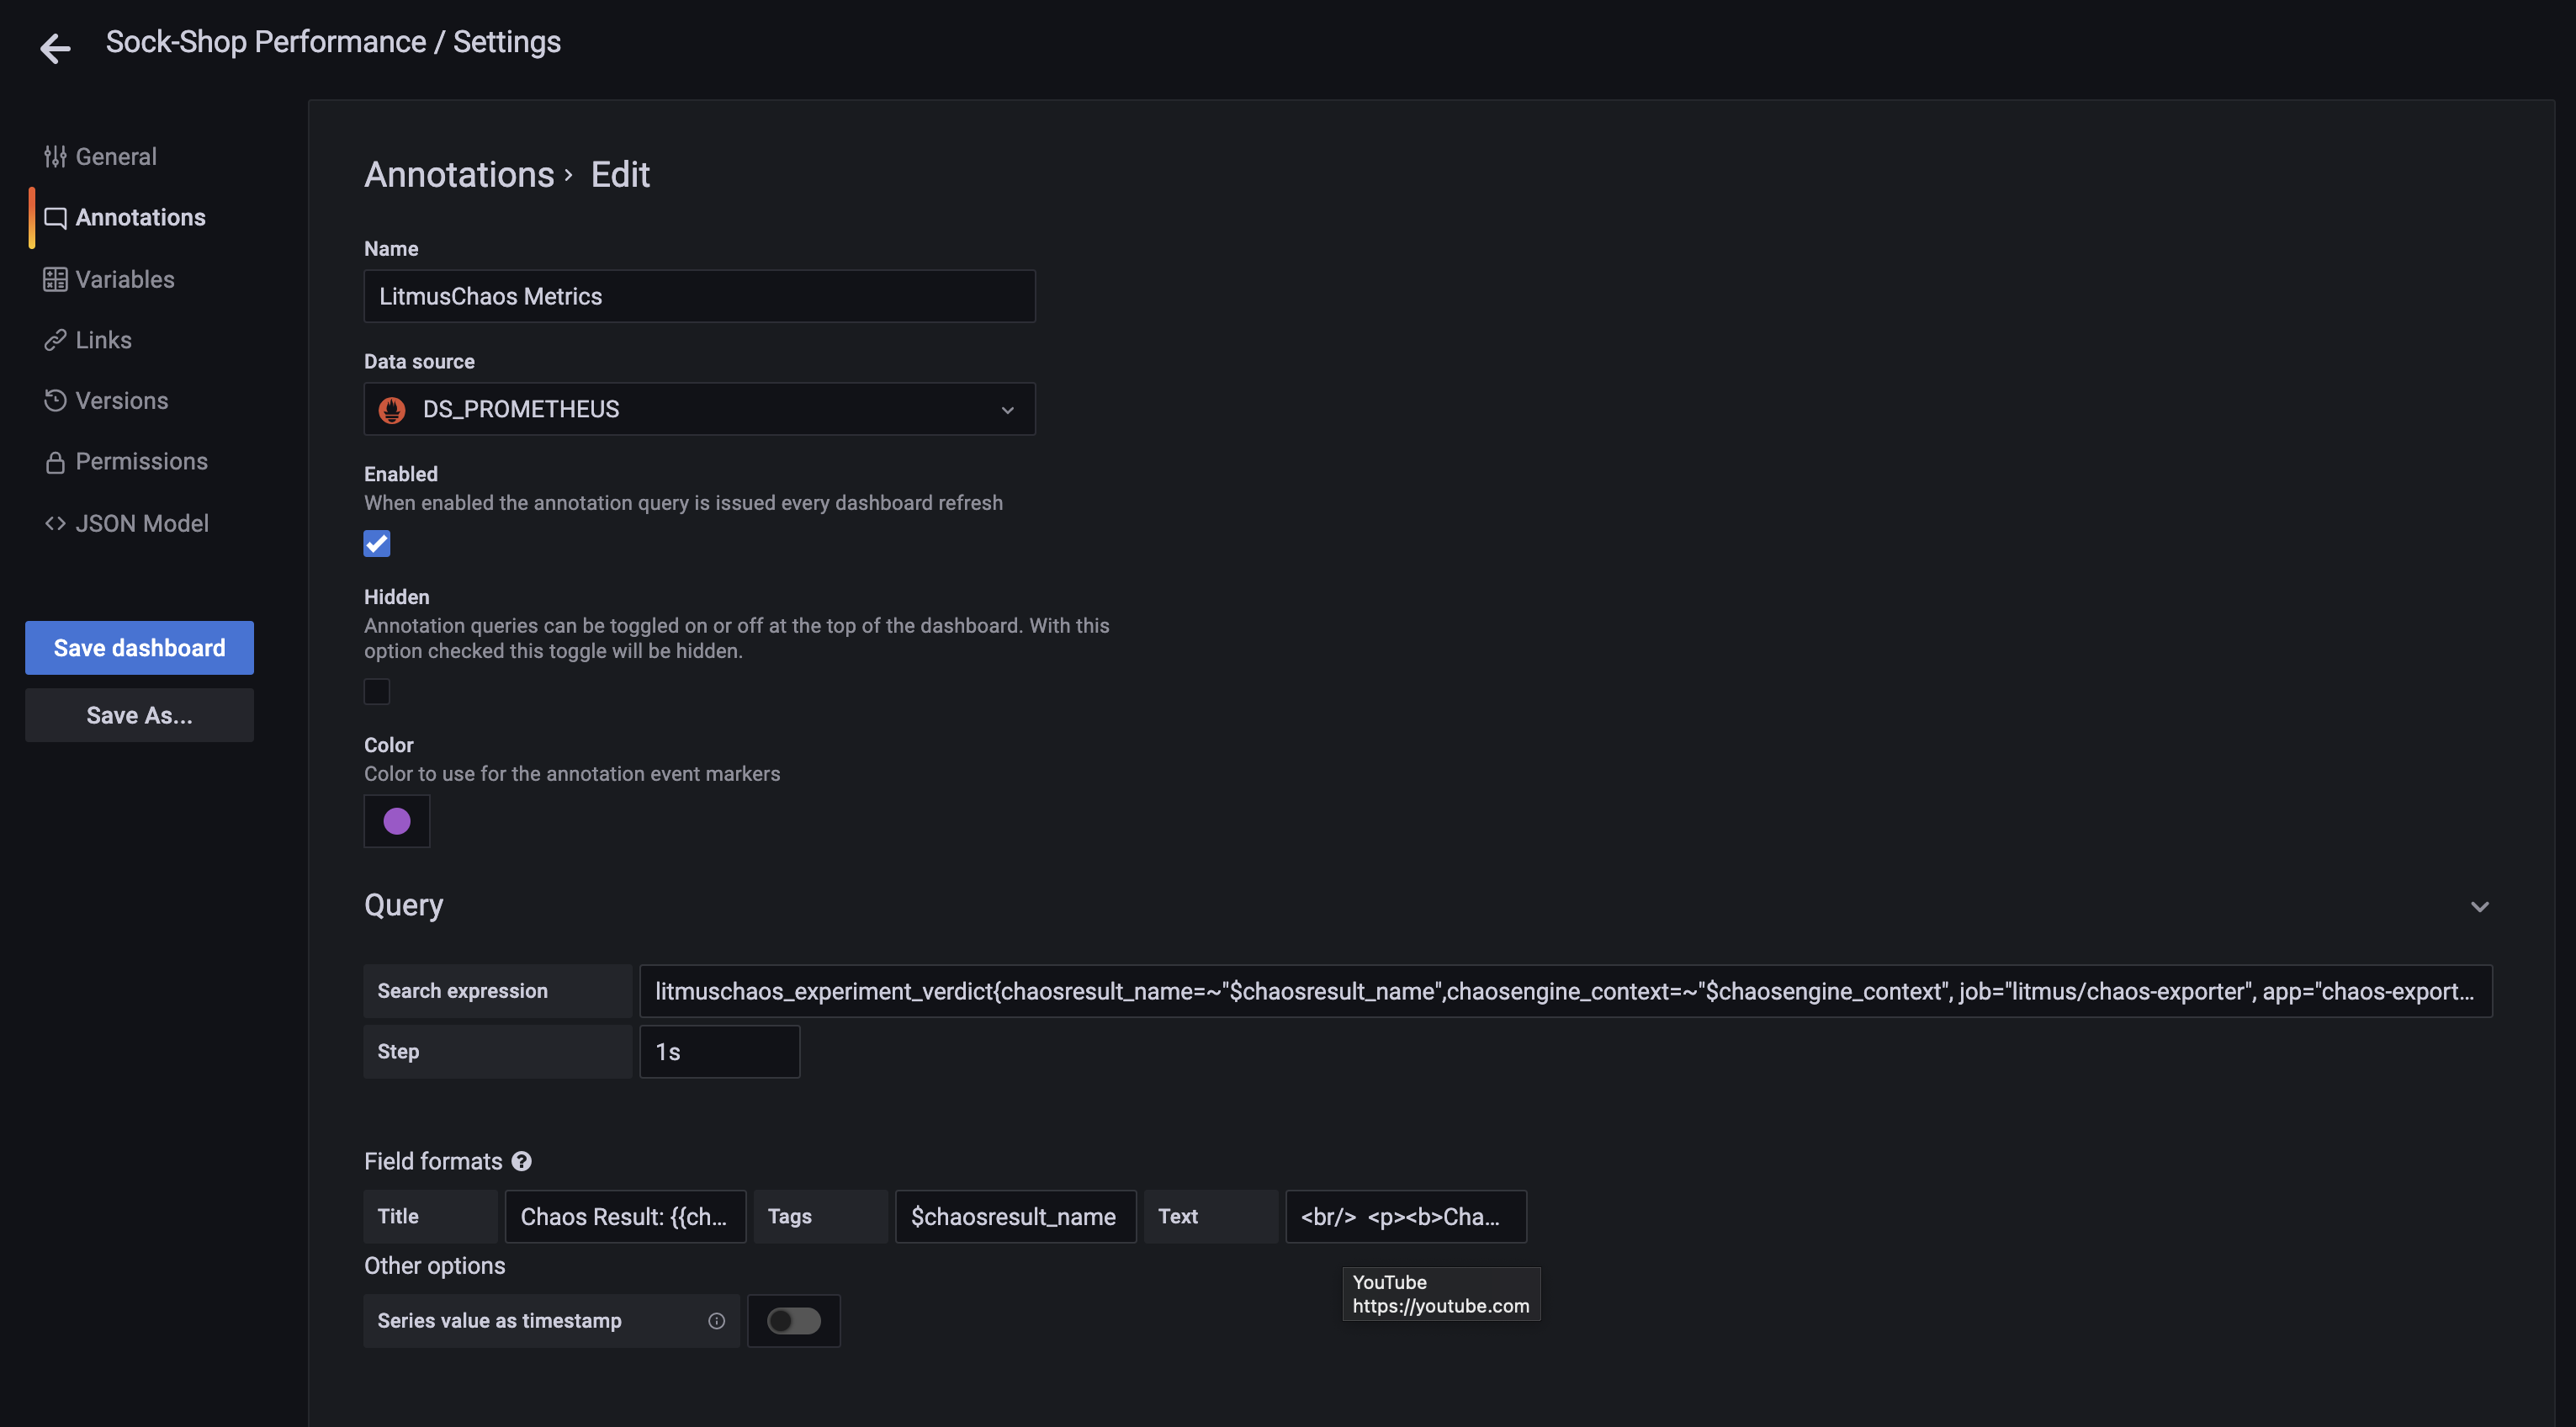 Chaos metric annotation
Fault injection and system failure alerts
These alerts can be configured and triggered based on conditions set on panels using the litmuschaos_awaited_experiments and litmuschaos_experiment_verdict metrics. The same can be issued to various channels registered for the corresponding alerts on Grafana.
Sample alert configuration for chaos result verdict
Query:
litmuschaos_experiment_verdict{job="litmus/chaos-exporter", app="chaos-exporter", chaosresult_verdict="Fail"}
Screenshots
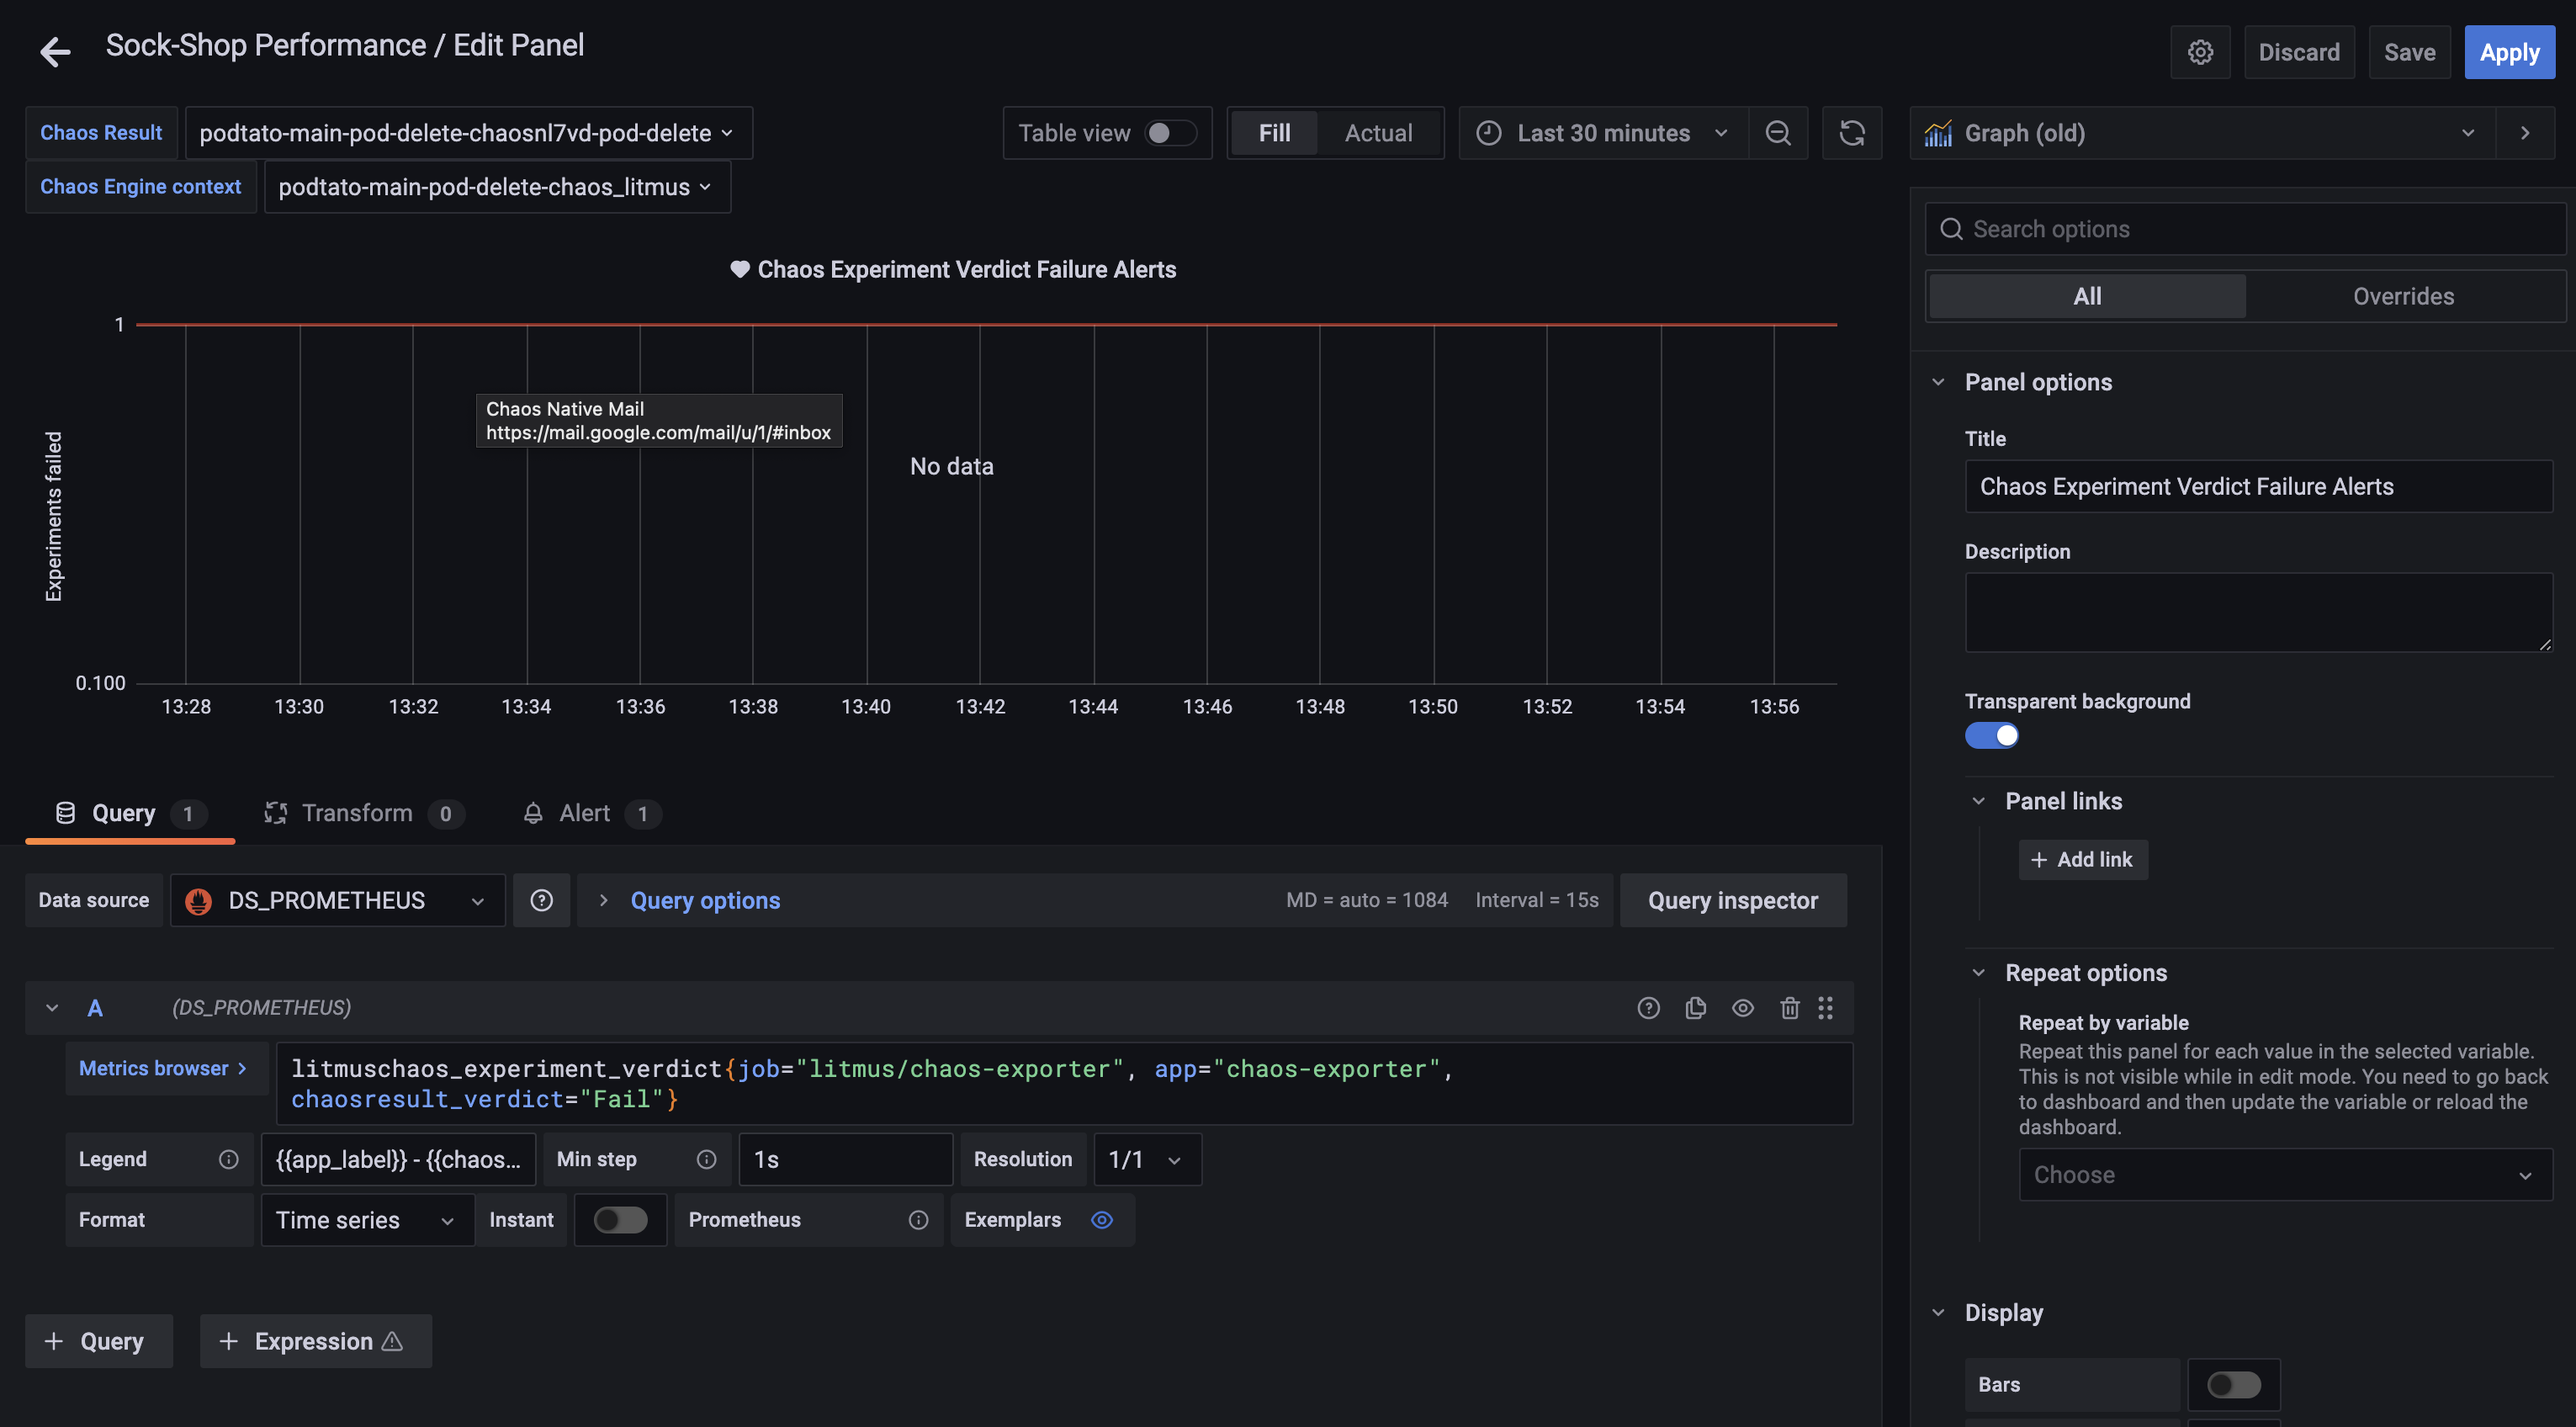 Experiment verdict failure alert query
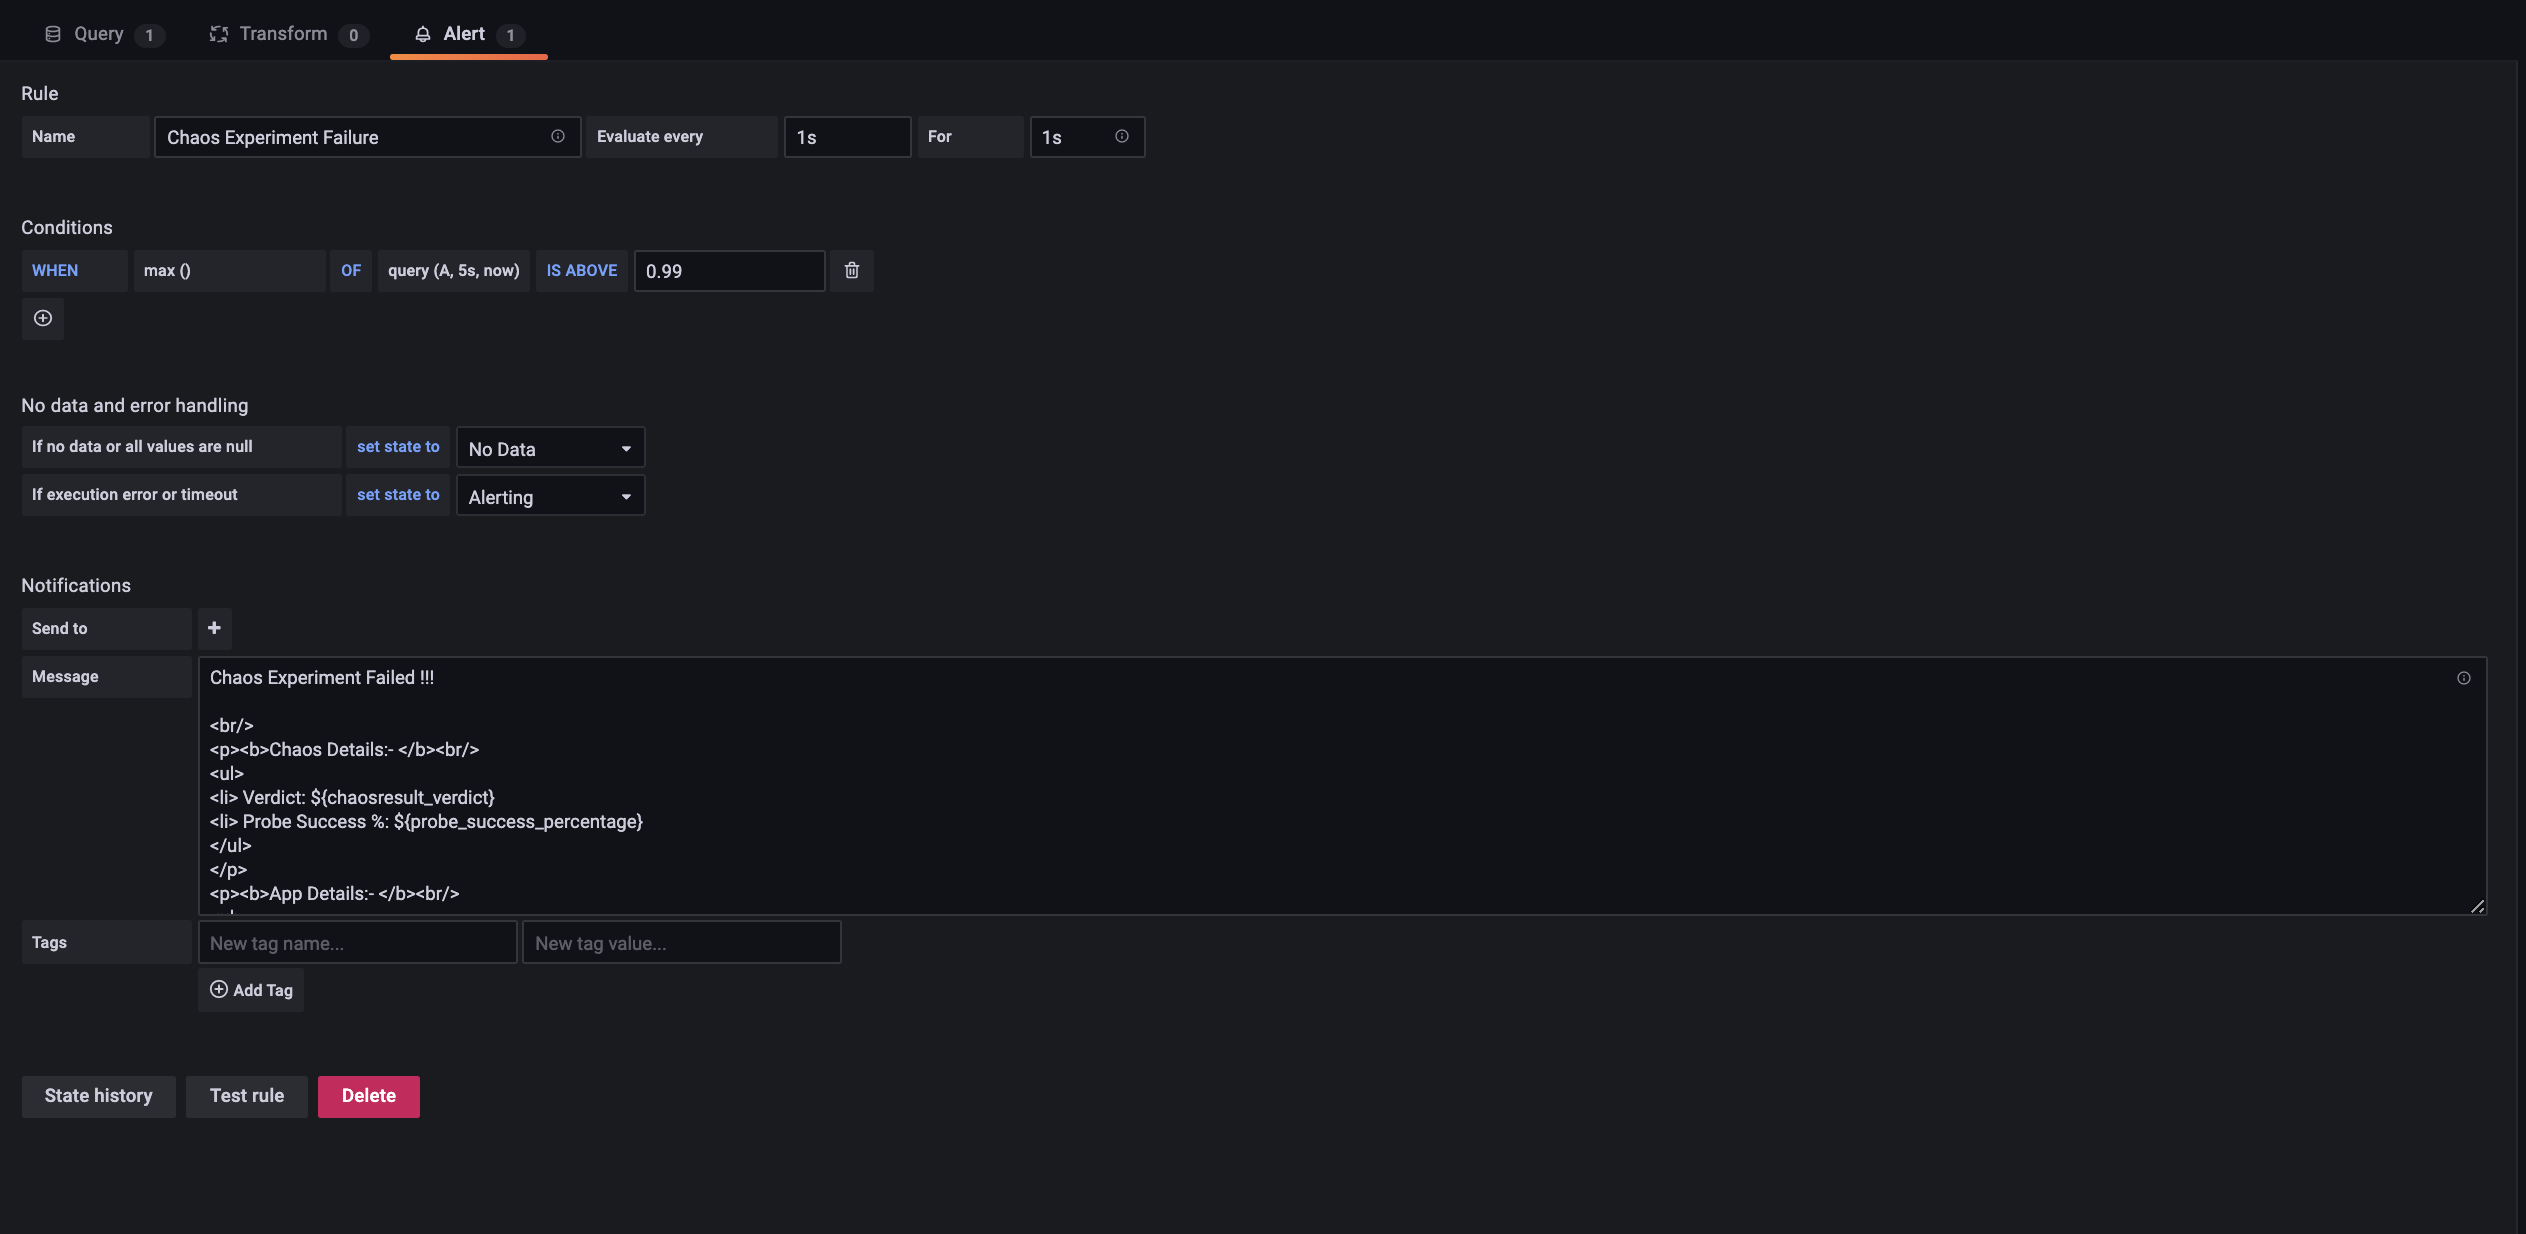 Experiment verdict failure alert configuration
Sample alert configuration for probe success percentage
Query:
litmuschaos_experiment_verdict{job="litmus/chaos-exporter", app="chaos-exporter", probe_success_percentage!="100.000000"}
Screenshots
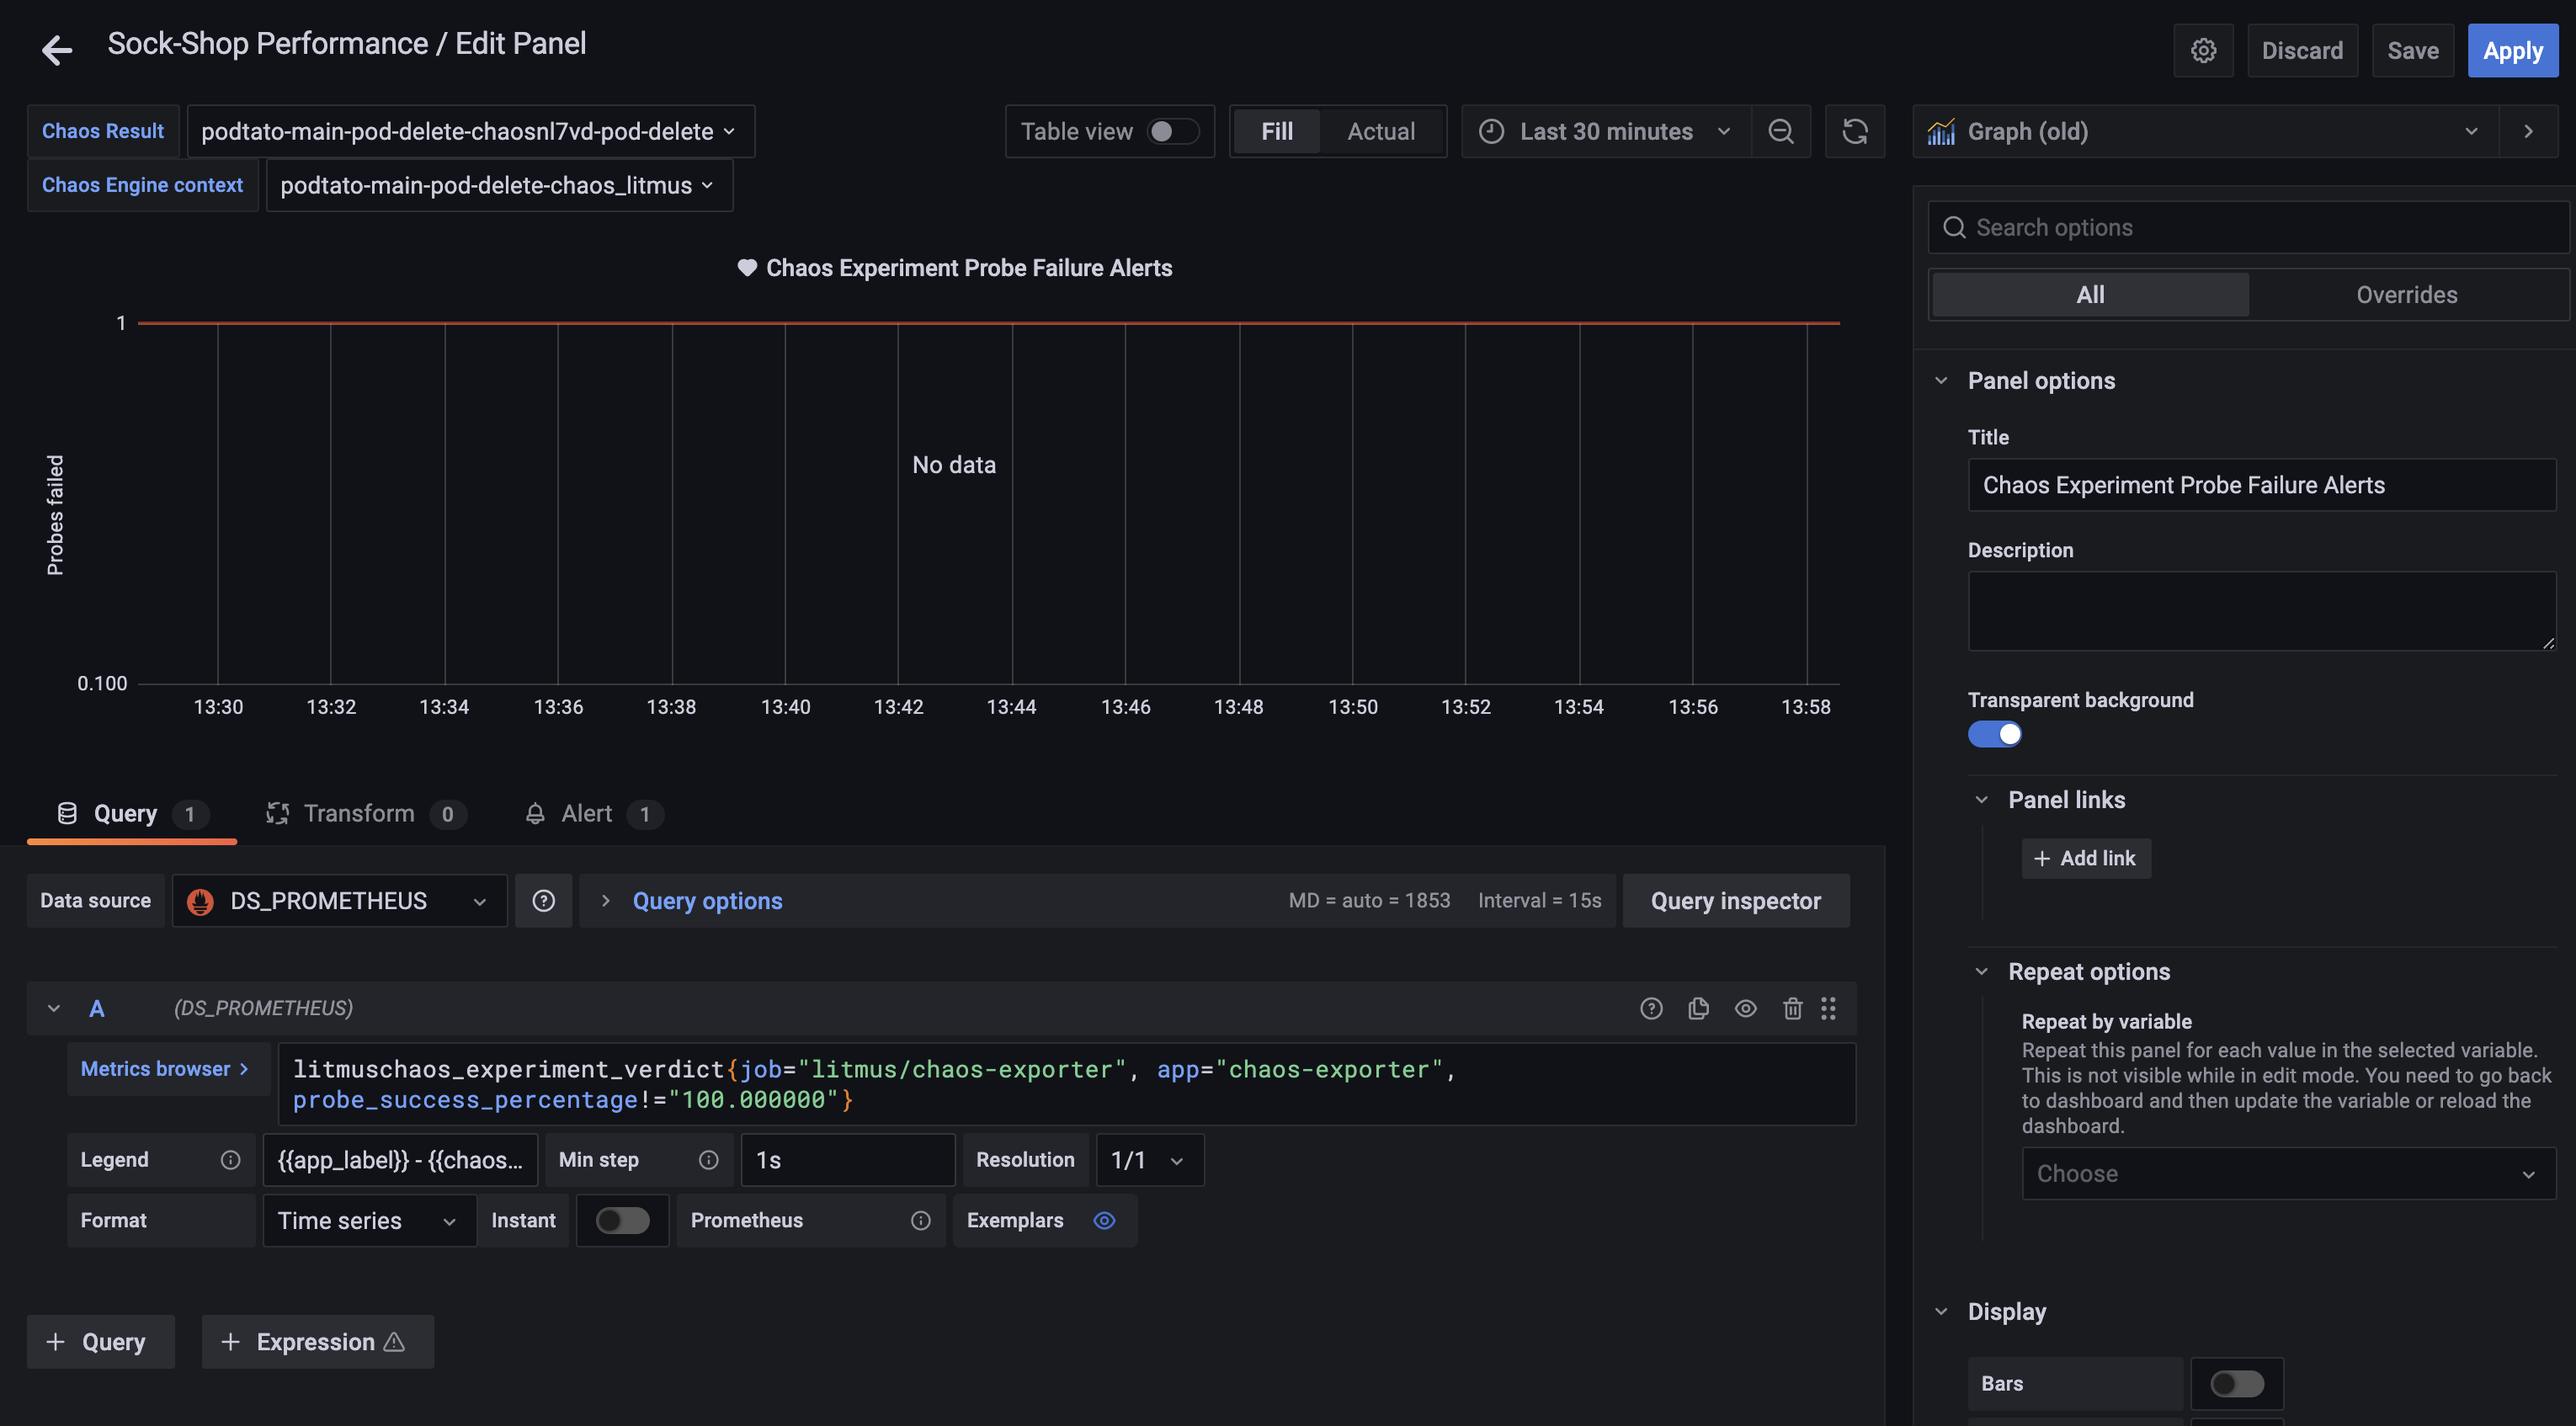 Probe failure alert query
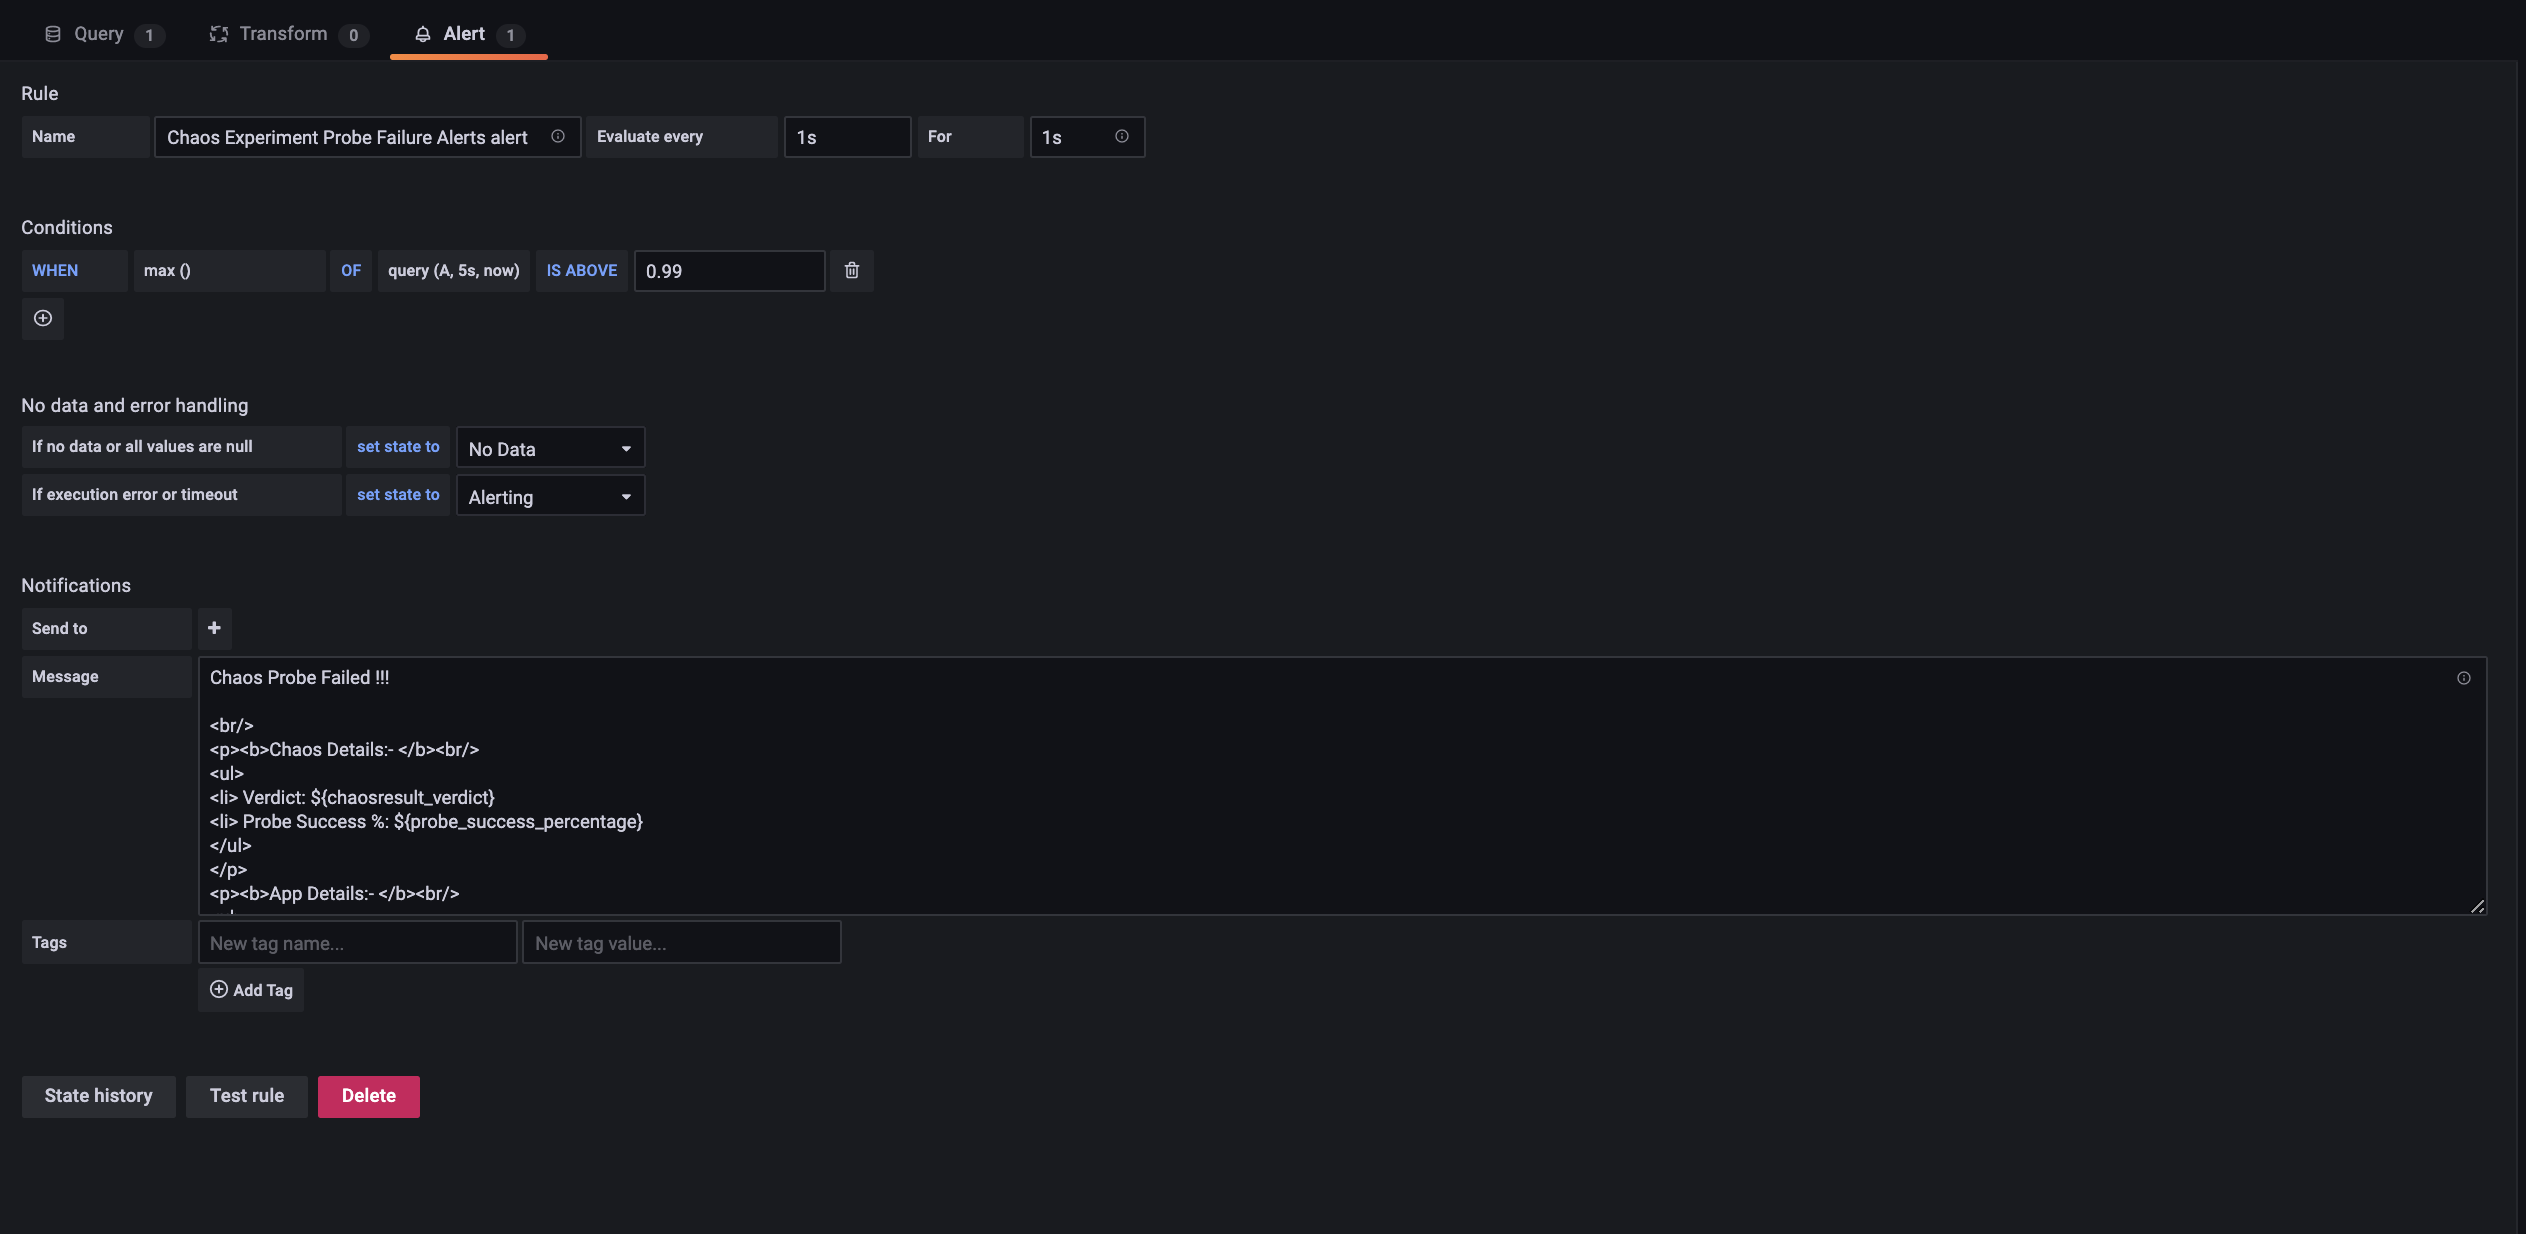 Probe failure alert configuration
Gauges from metrics for aggregated view of chaos injections
Metrics from chaos-exporter like litmuschaos_passed_experiments, litmuschaos_failed_experiments and litmuschaos_awaited_experiments when ingested in Prometheus which is connected as a data source can provide an aggregated view of chaos injections on a chaos delegate cluster or namespace.
Queries:
Total Experiments Runs
sum(litmuschaos_passed_experiments{job="litmus/chaos-exporter"} + litmuschaos_failed_experiments{job="litmus/chaos-exporter"})
Passed Experiments
sum(litmuschaos_passed_experiments{job="litmus/chaos-exporter"})
Failed Experiments
sum(litmuschaos_failed_experiments{job="litmus/chaos-exporter"})
Queued Experiments
sum(litmuschaos_awaited_experiments{job="litmus/chaos-exporter"})
Screenshot
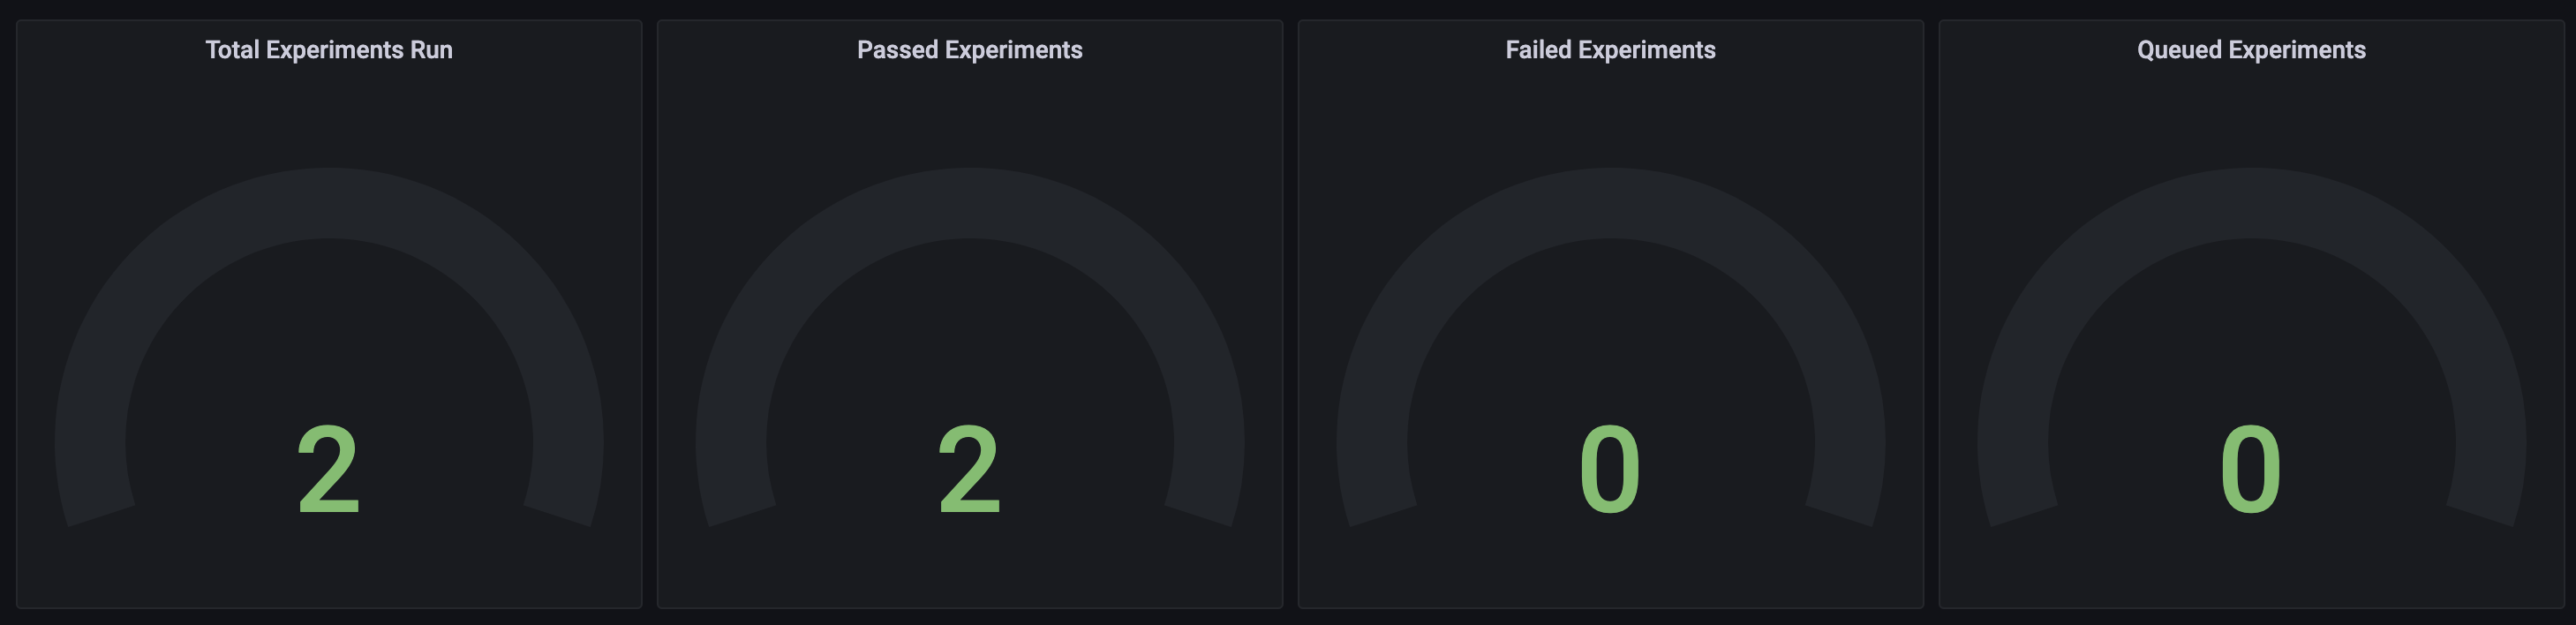 Gauge metrics
Resources
Observability Considerations in Chaos: The Metrics Story