Observe chaos experiment
Visualization is an important aspect while doing chaos engineering. It allows the user to discover and inspect different changes that occur during a Chaos Experiment execution.
With ChaosCenter, the real-time data and status of the chaos experiments can be observed. Valuable information like pod logs, chaos experiment status, and chaos results can also be viewed.
Prerequisites
The following are required before creating a Chaos Experiment:
- ChaosCenter
- Chaos Experiments
Chaos experiment
If the user chooses to Save and Run the experiment, they will be redirected directly to the experiment execution page where the experiment execution steps will be visualized, else they will be taken Chaos Experiment Page.
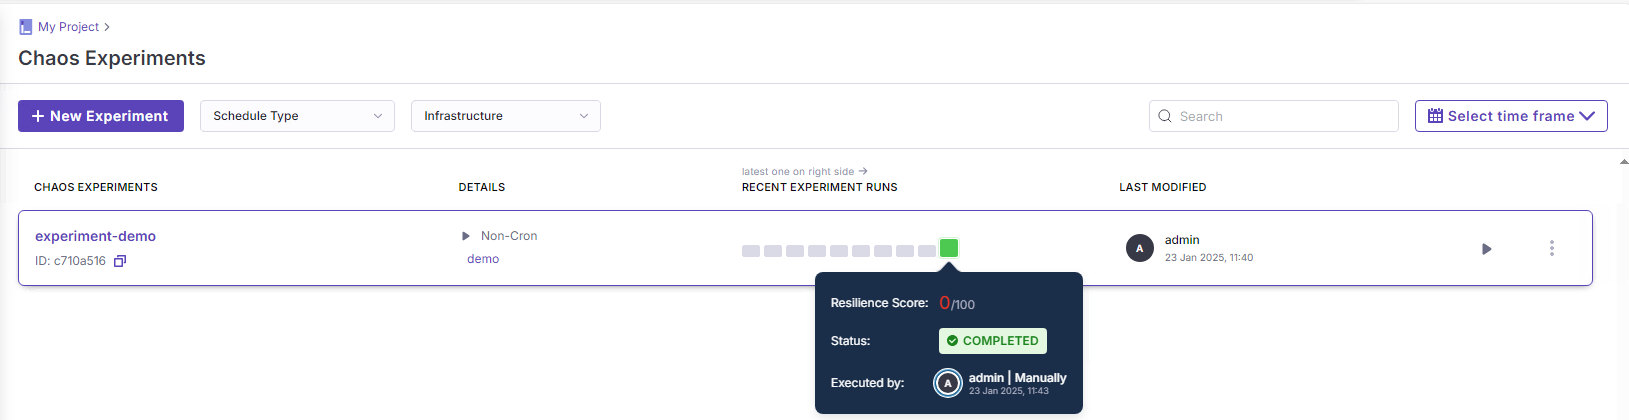
Observe an experiment
To observe a chaos experiment, user needs to select the highlighted experiment run box from the heatmap, it will redirect to experiment run execution page.
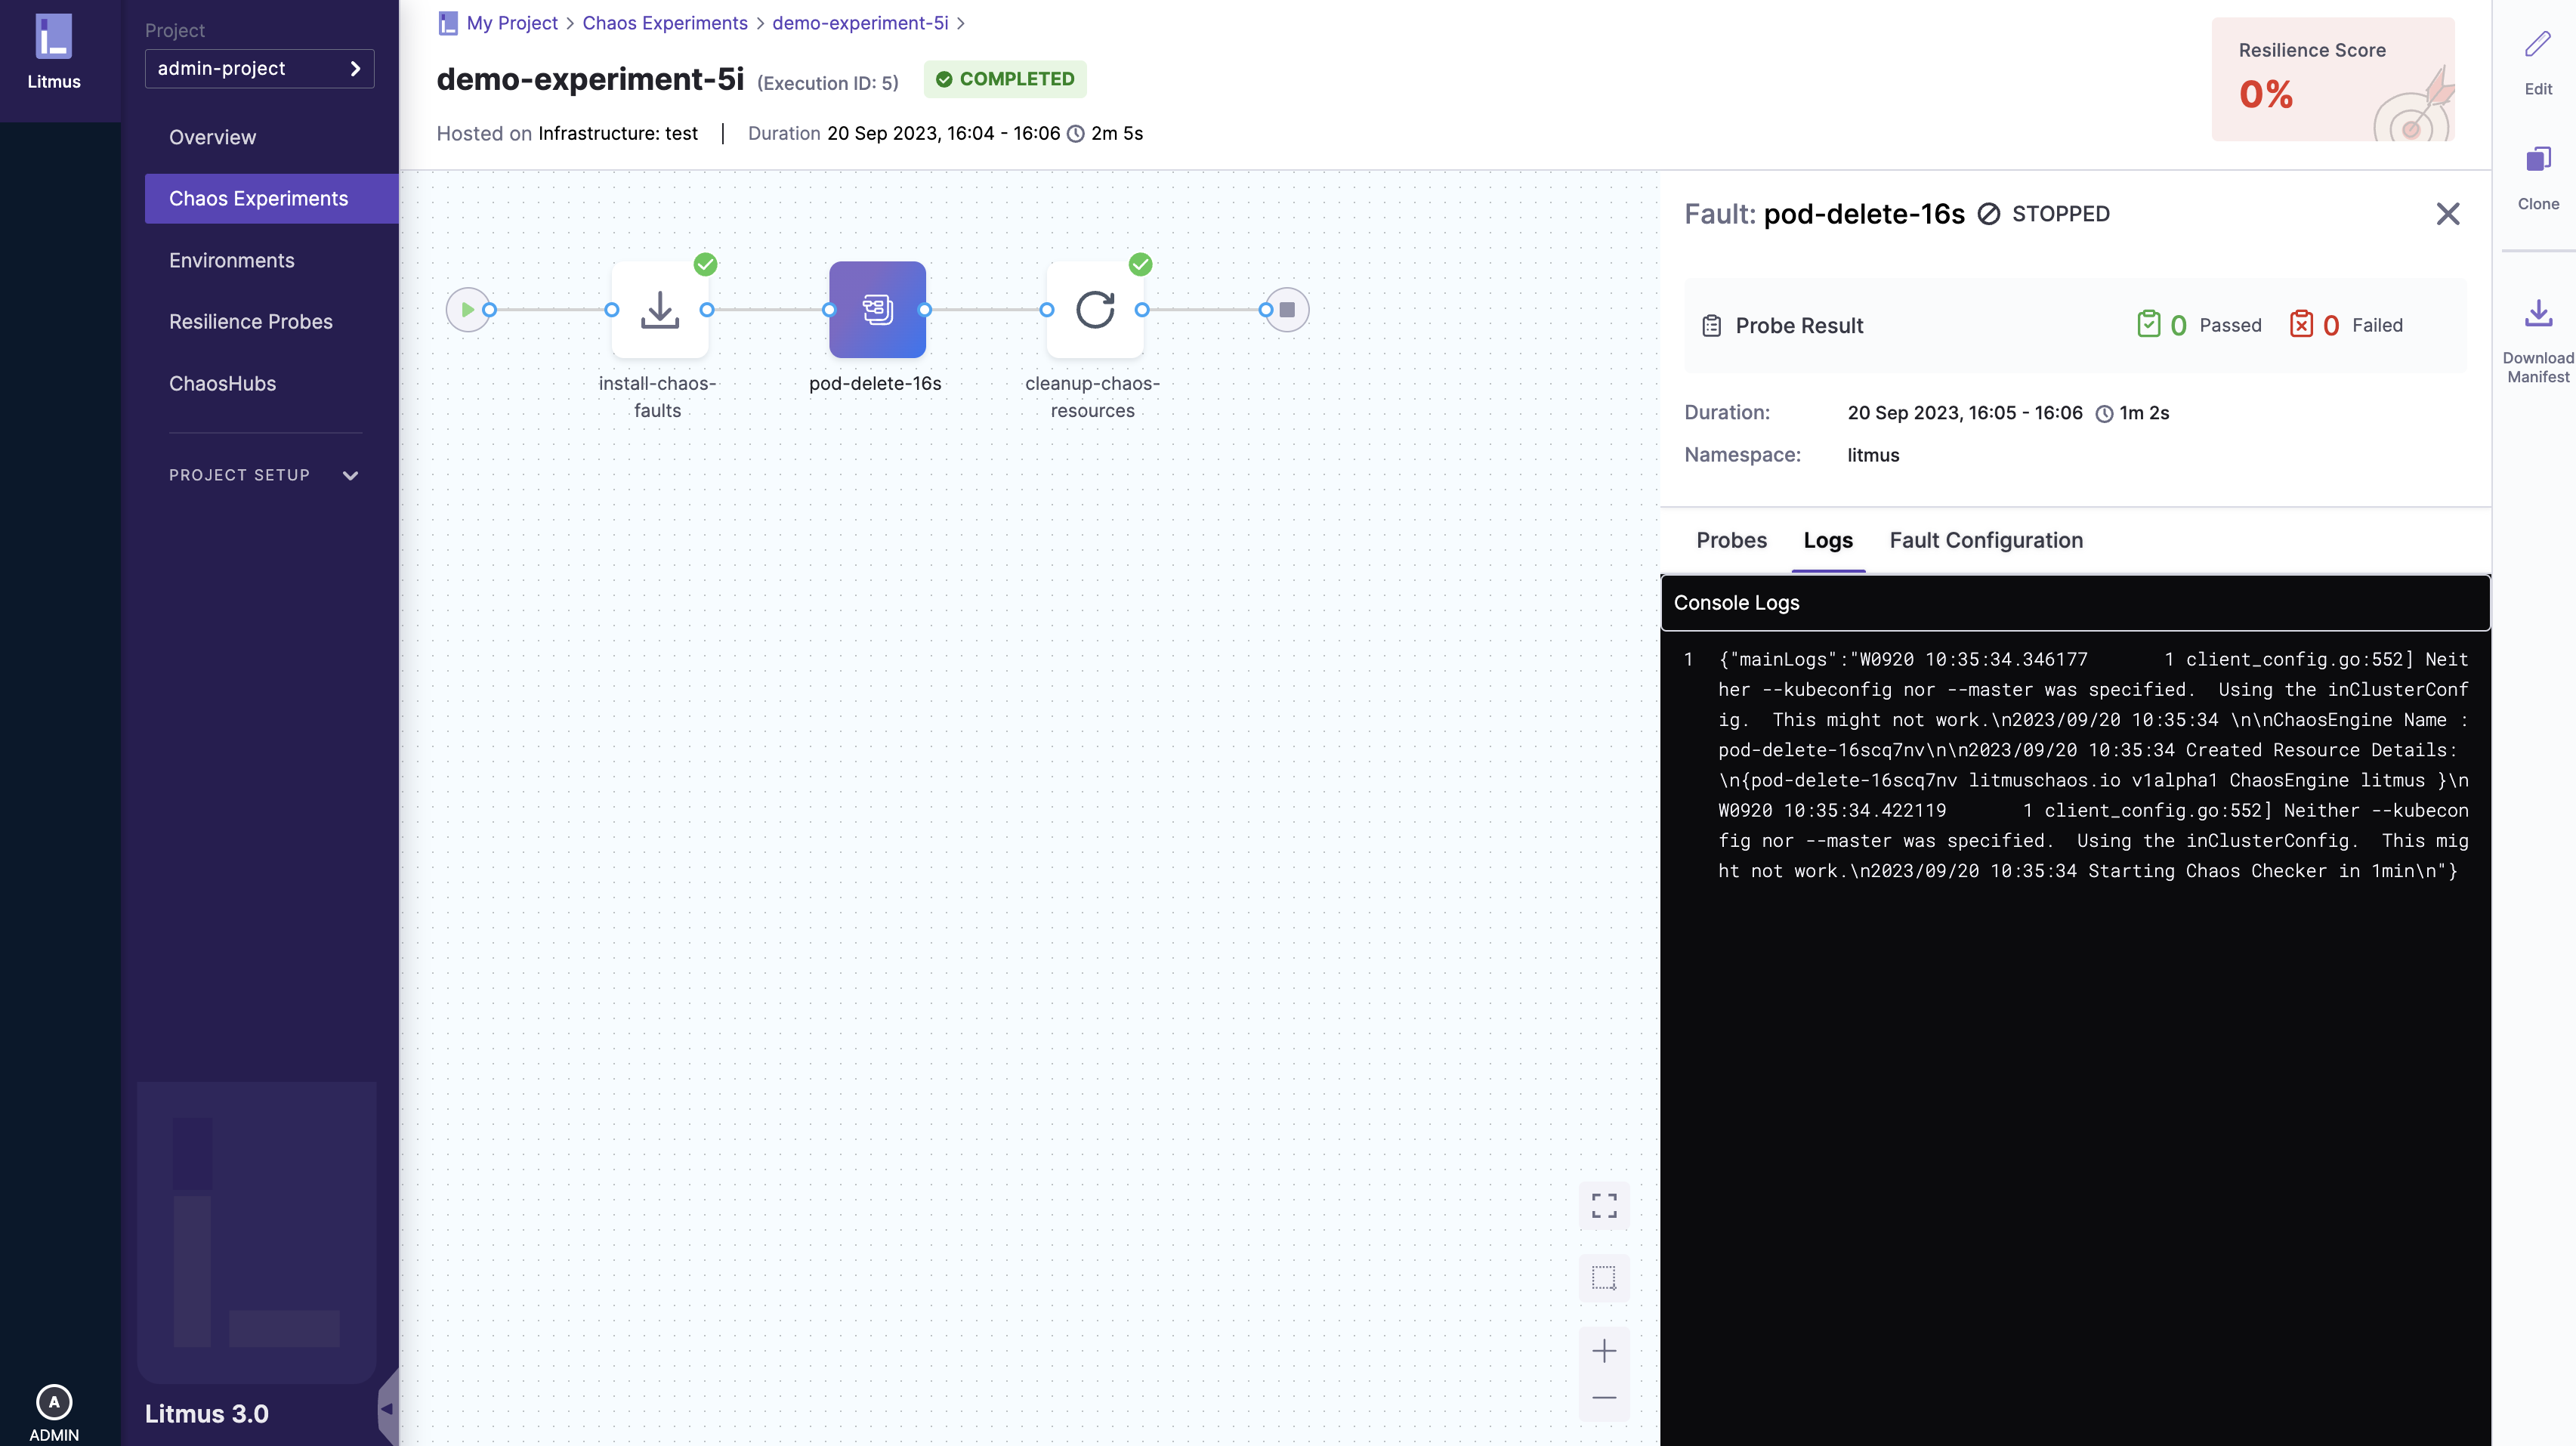
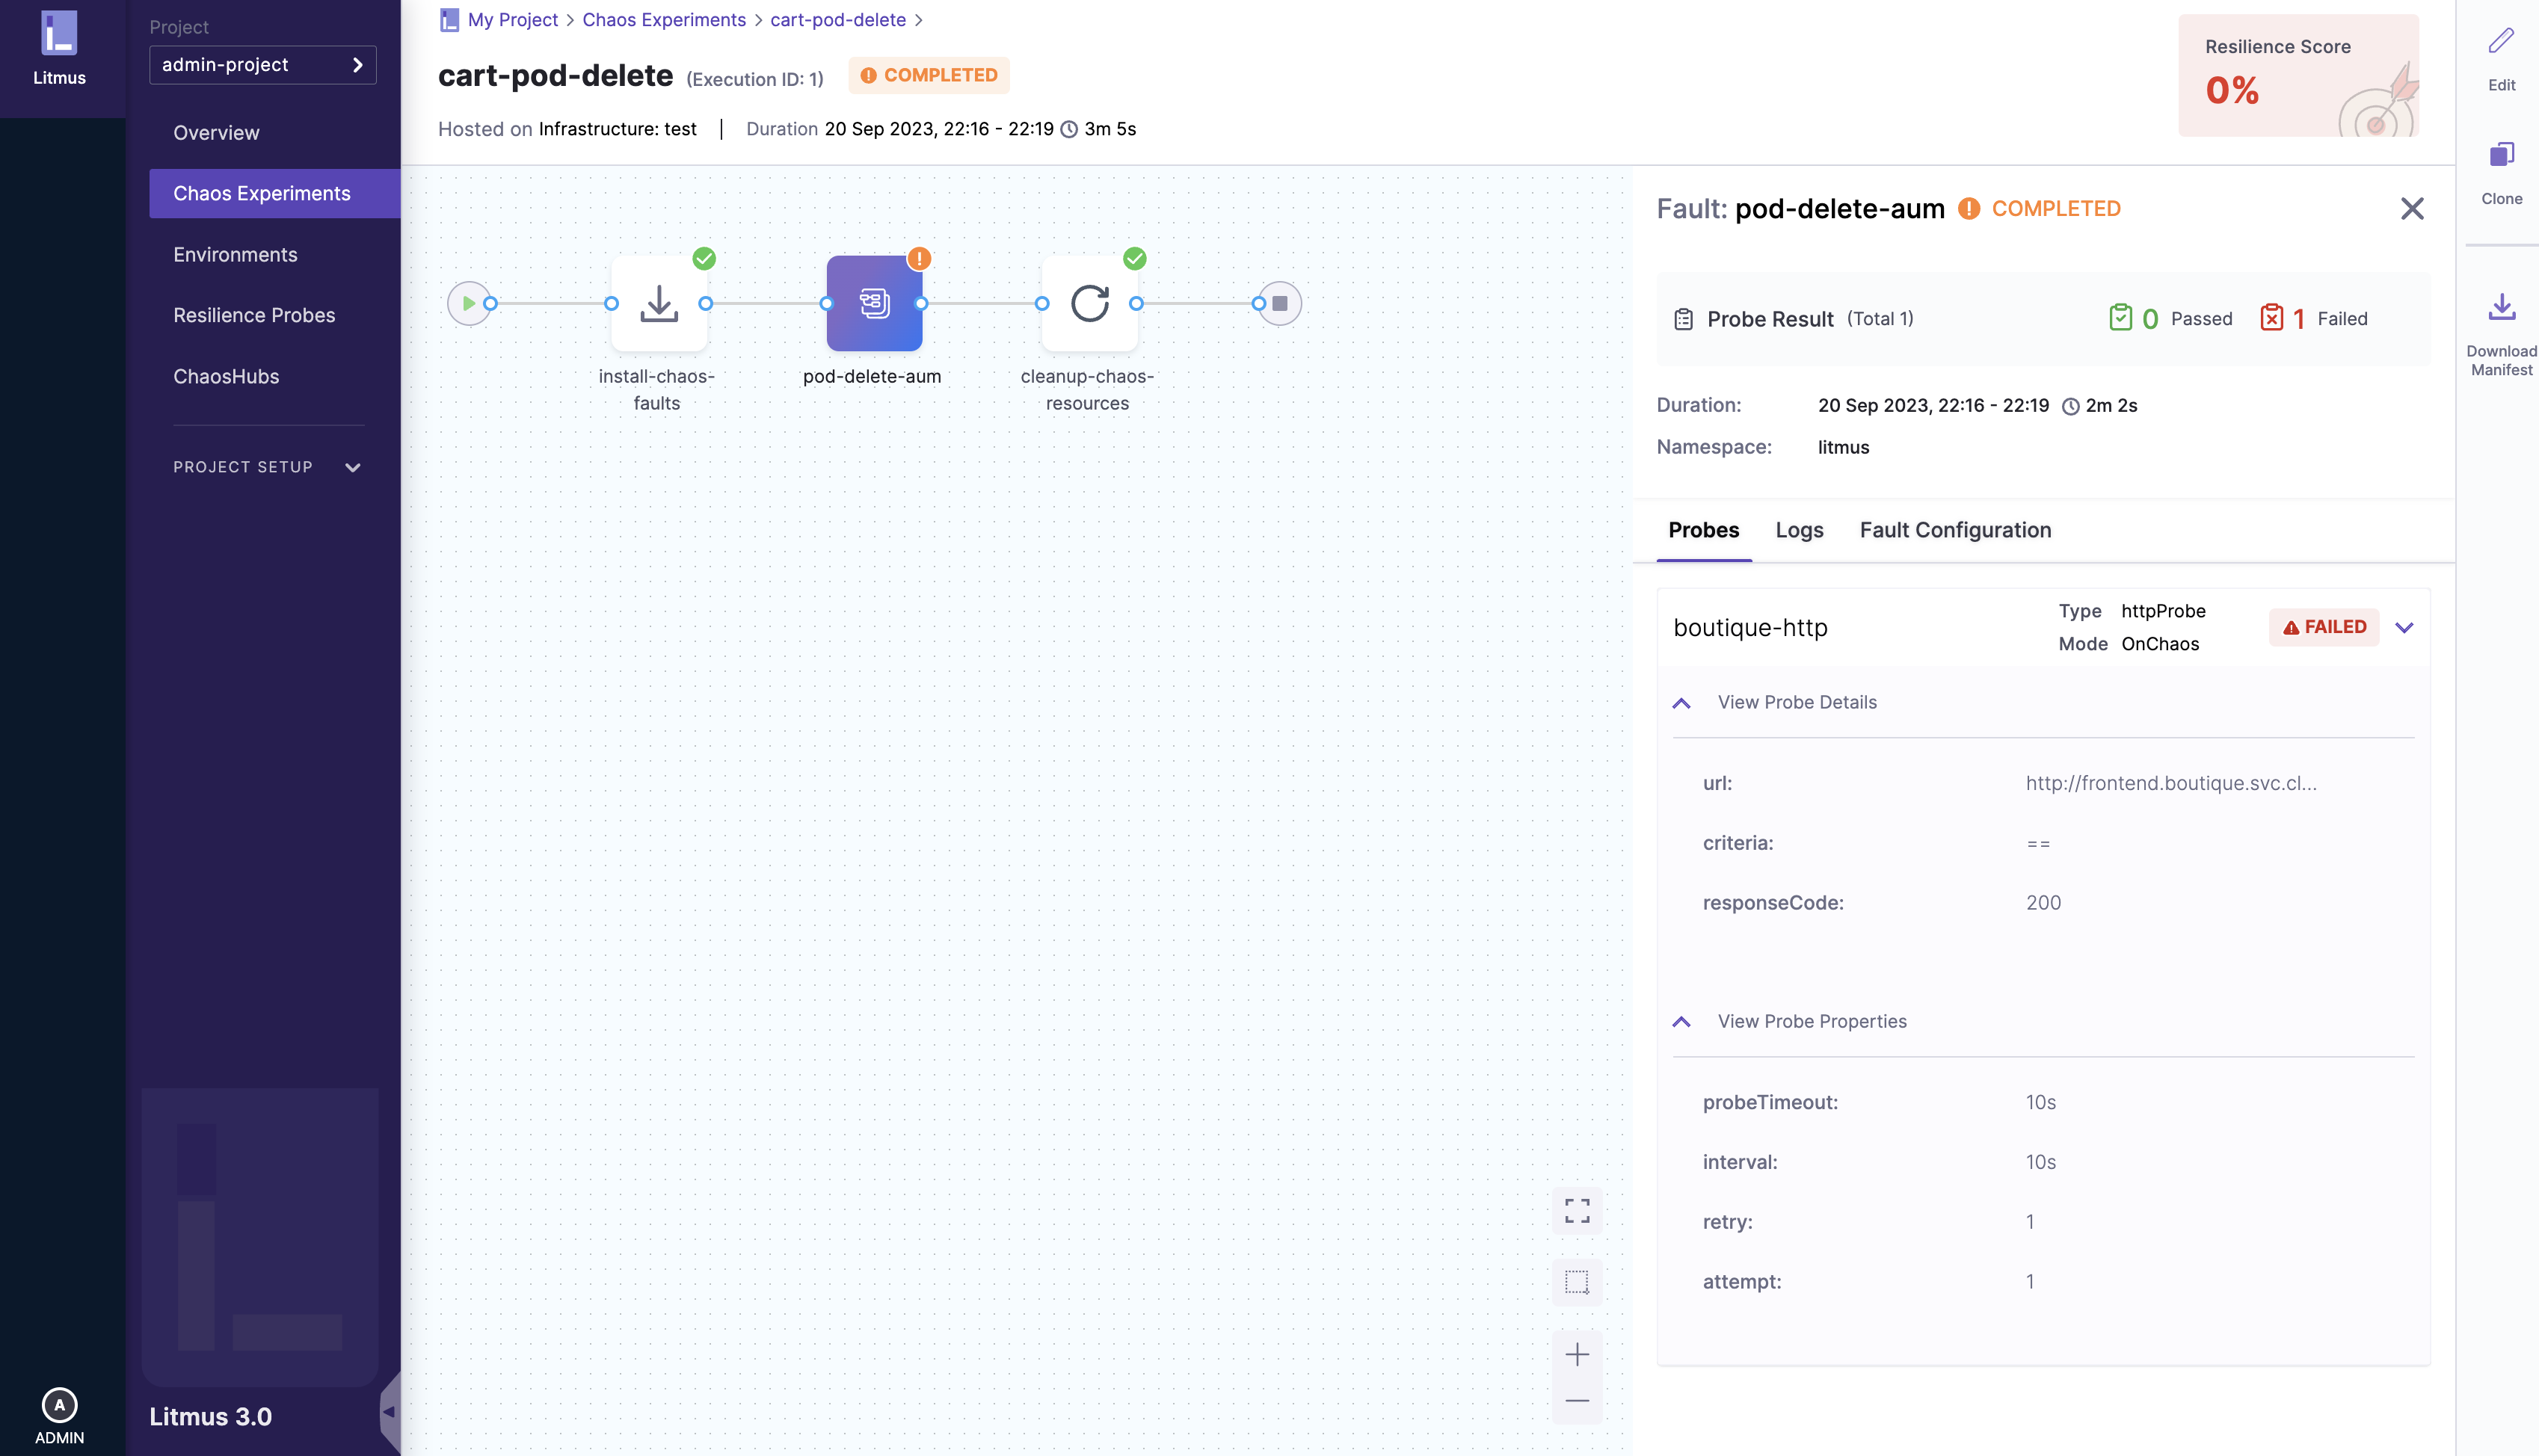
In the chaos experiment, a realtime graph of the chaos experiment is displayed. This graph contains valuable information regarding the status of individual steps of the chaos experiment.
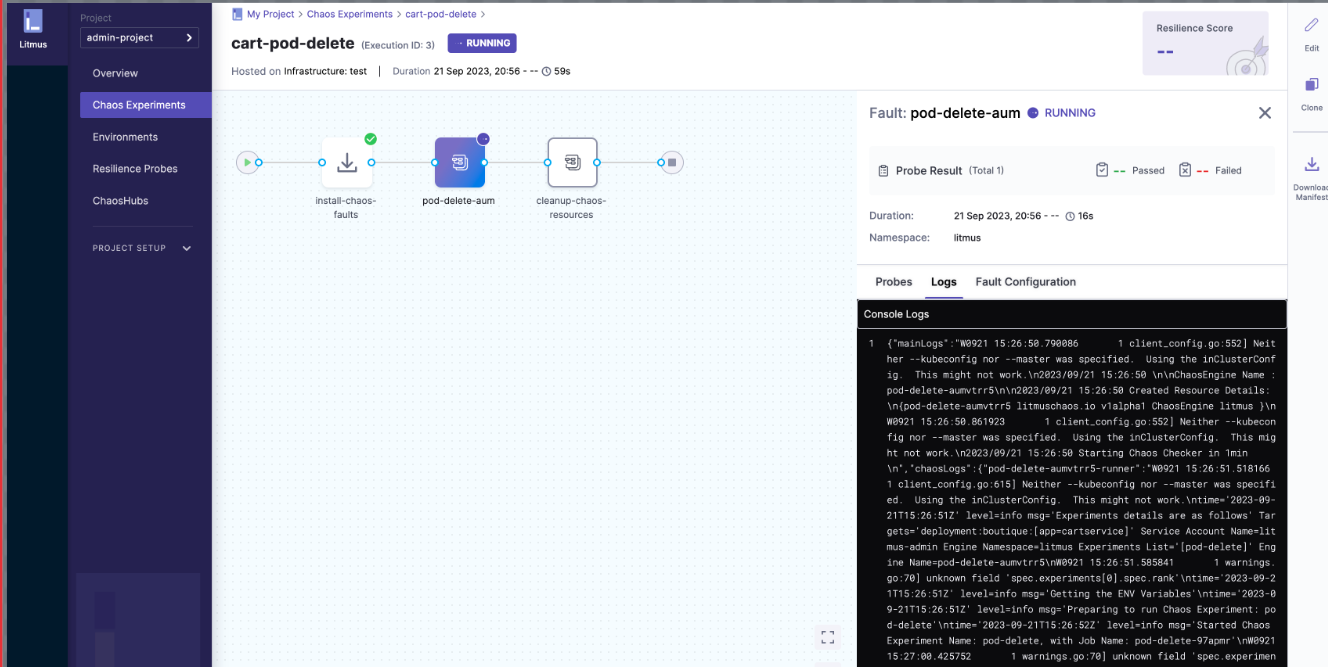
To view the details of each step, the user can click on the individual nodes and the right side pane will display the node details, results(once the execution is complete), and the logs related to it.
Summary
After scheduling a chaos experiment, a user can view the details of the running chaos experiment from the ChaosCenter. ChaosCenter provides a real-time graph that is used to visualize the chaos experiment and get the details of individual steps of the chaos experiment. Important details like the logs and target applications can be viewed from ChaosCenter. Once the chaos experiment execution is completed, the resiliency score is calculated and the ChaosResult for the ChaosEngine pods is available.